|
|


Share
E.S.H.L. PLAYOFFS HOCKEY SPRING PLAYOFFS 2026 LEAGUE
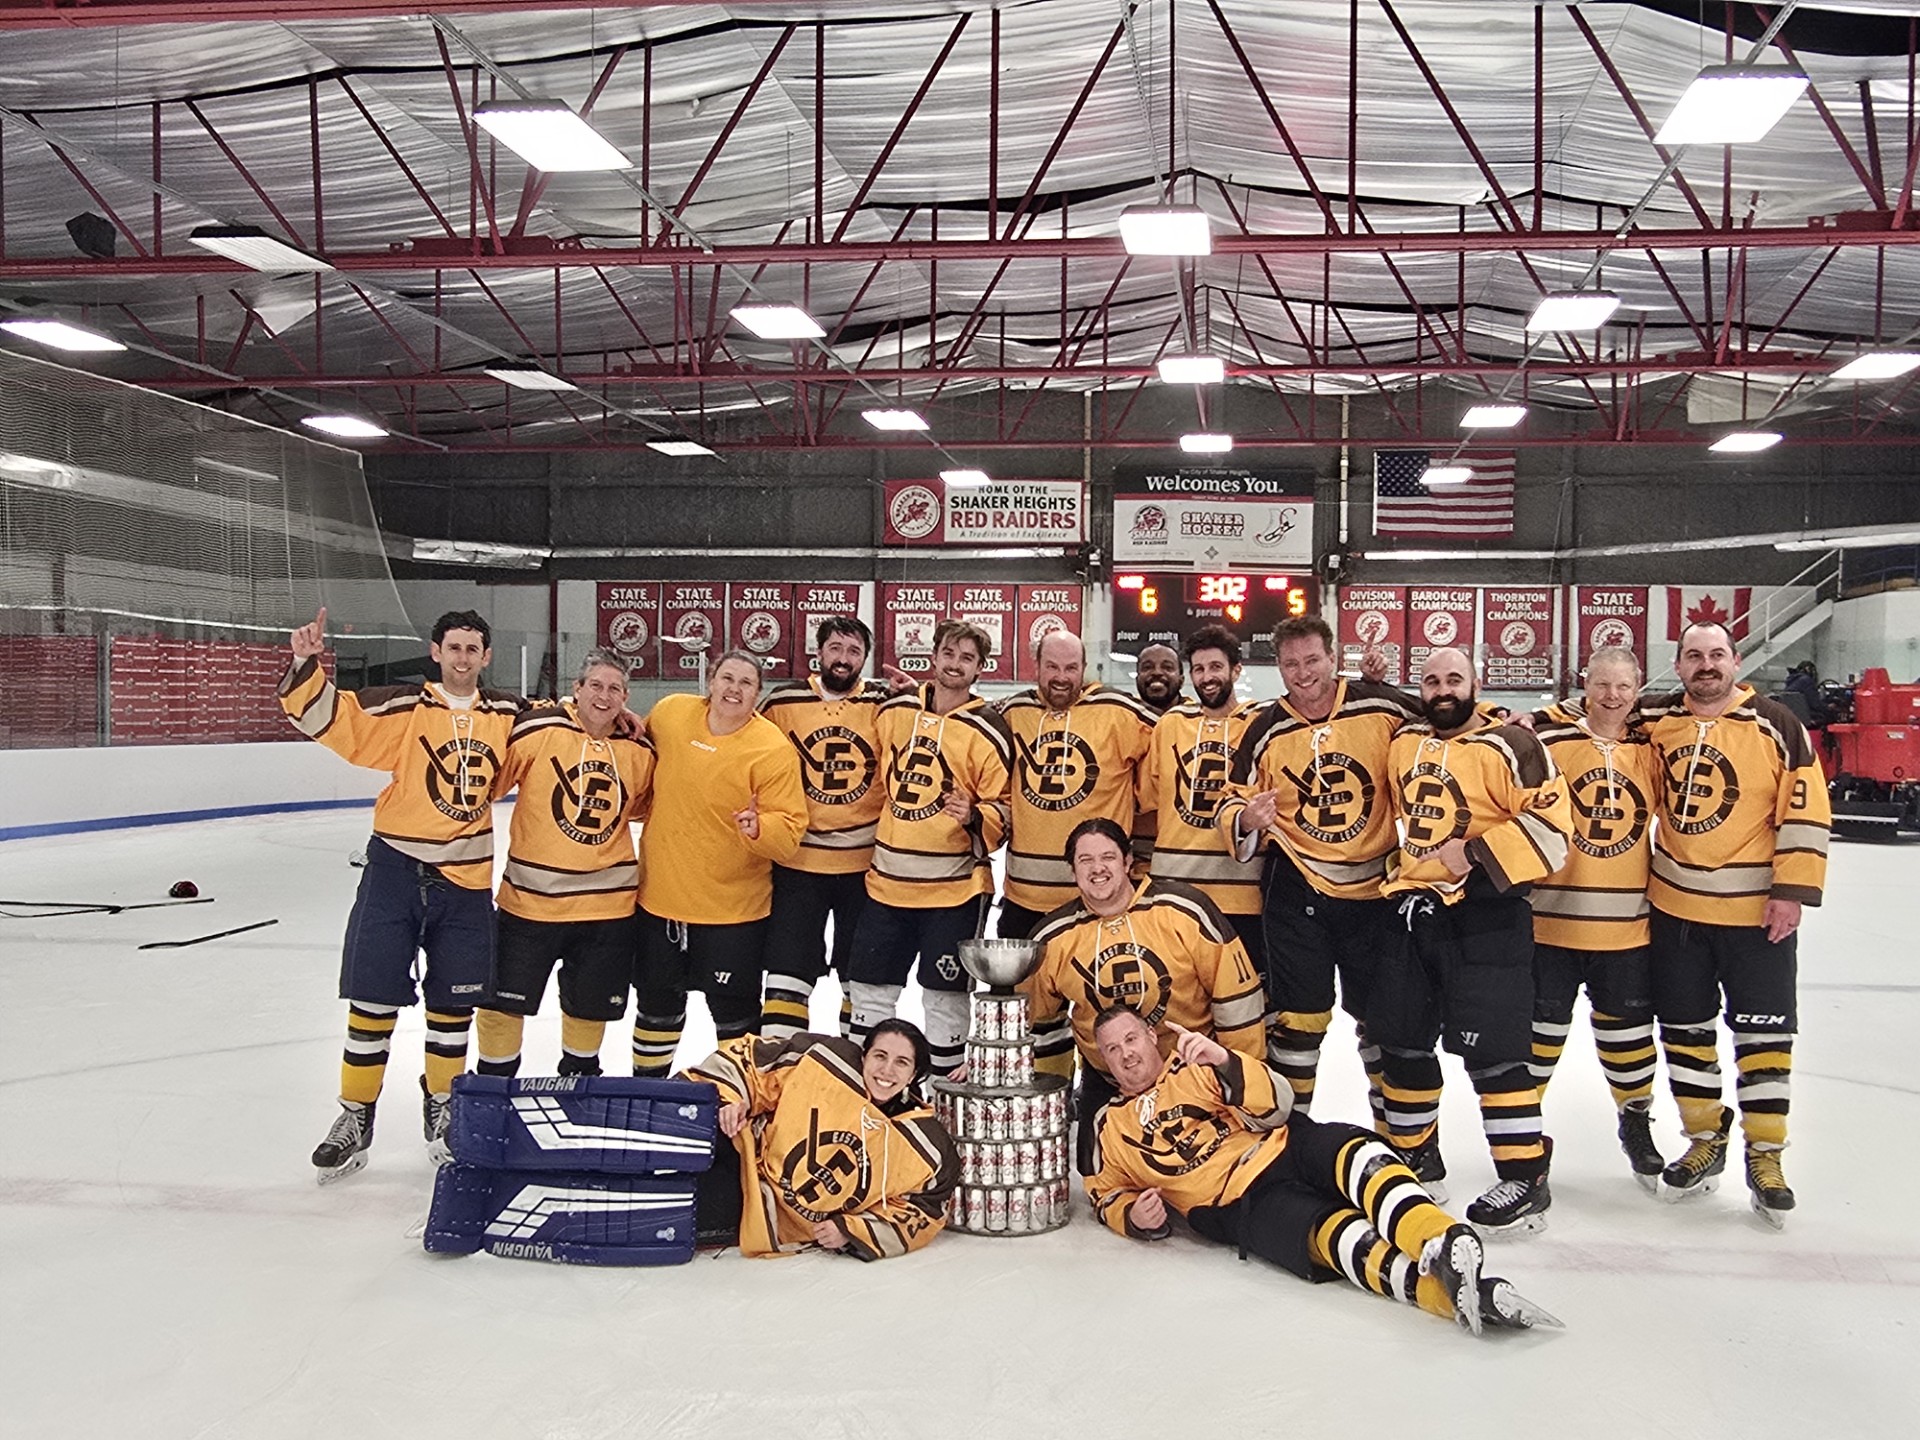
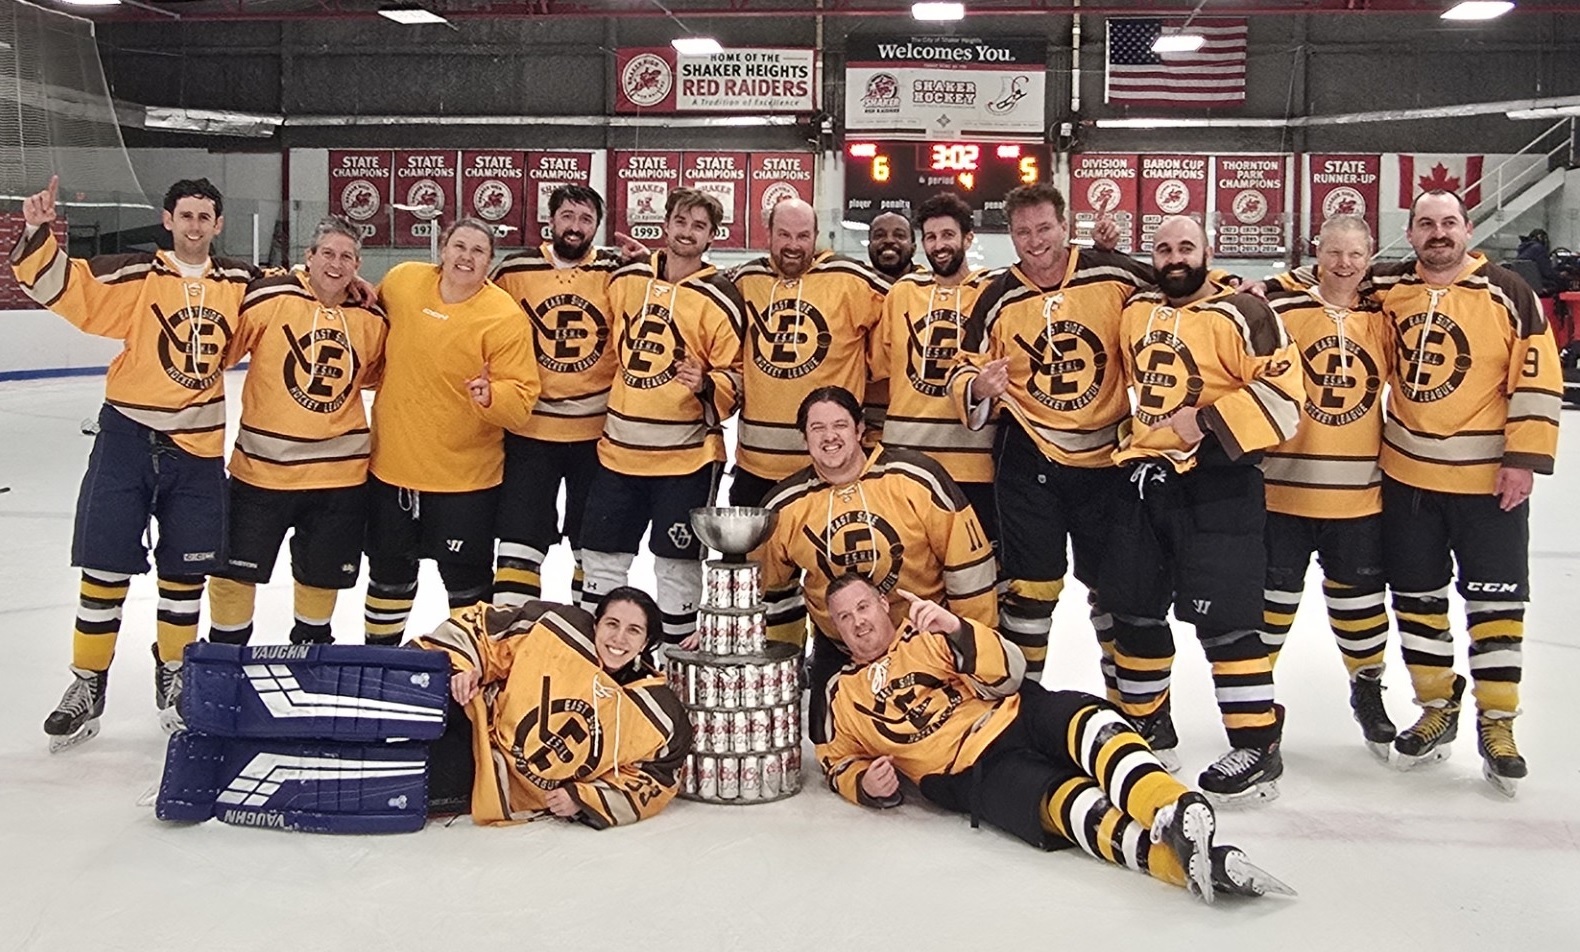
CONGRATULATIONS TO THE YELLOW TEAM
EAST SIDE HOCKEY LEAGUE SPRING 2026 REGULAR & POST SEASON CHAMPIONS!!
CONGRATULATIONS TO THE WHITE TEAM
EAST SIDE HOCKEY LEAGUE SPRING 2026 SEASON CHAMPS & POST SEASON RUNNERS-UP!!
6/ 4/26 | PRINTOUT #: 1
BLUE ( 1 - 1 - 0 )
Individual Team Statistics
|
Players |
GP |
G |
A |
PTS |
SOG |
SPCT |
PIM |
G/G |
A/G |
P/G |
S/G |
PIM/G |
HT |
PM |
GS |
LS |
| 1 . |
Jeff Deacon |
2 |
2 |
1 |
3 |
10 |
0.200 |
4 |
1.00 |
0.50 |
1.50 |
5.00 |
2.00 |
0 |
0 |
2 |
2 |
| 2 . |
Jacob Hoberman |
2 |
0 |
3 |
3 |
5 |
0.000 |
0 |
0.00 |
1.50 |
1.50 |
2.50 |
0.00 |
0 |
0 |
0 |
0 |
| 3 . |
Sean-Paul Mauro |
2 |
3 |
0 |
3 |
11 |
0.273 |
0 |
1.50 |
0.00 |
1.50 |
5.50 |
0.00 |
1 |
0 |
0 |
1 |
| 4 . |
Maxwell Rady |
2 |
0 |
1 |
1 |
3 |
0.000 |
0 |
0.00 |
0.50 |
0.50 |
1.50 |
0.00 |
0 |
0 |
0 |
0 |
| 5 . |
Zach Schulte |
2 |
1 |
0 |
1 |
4 |
0.250 |
0 |
0.50 |
0.00 |
0.50 |
2.00 |
0.00 |
0 |
0 |
1 |
1 |
| 6 . |
Jimmy Moore |
1 |
0 |
0 |
0 |
0 |
0.000 |
0 |
0.00 |
0.00 |
0.00 |
1.00 |
0.00 |
0 |
0 |
0 |
0 |
| 7 . |
Chuck Shulte |
1 |
0 |
0 |
0 |
0 |
0.000 |
0 |
0.00 |
0.00 |
0.00 |
1.00 |
0.00 |
0 |
0 |
0 |
0 |
| 8 . |
Mark Wilson |
2 |
0 |
0 |
0 |
4 |
0.000 |
0 |
0.00 |
0.00 |
0.00 |
2.00 |
0.00 |
0 |
0 |
0 |
0 |
| 9 . |
Wes Deacon G |
2 |
0 |
0 |
0 |
0 |
0.000 |
0 |
0.00 |
0.00 |
0.00 |
0.50 |
0.00 |
0 |
0 |
0 |
0 |
| 10 . |
Sub #9 |
1 |
0 |
0 |
0 |
0 |
0.000 |
4 |
0.00 |
0.00 |
0.00 |
1.00 |
4.00 |
0 |
0 |
0 |
0 |
| 11 . |
Dan Bacon |
2 |
0 |
0 |
0 |
5 |
0.000 |
0 |
0.00 |
0.00 |
0.00 |
2.50 |
0.00 |
0 |
0 |
0 |
0 |
| 12 . |
Ryan Dee |
1 |
0 |
0 |
0 |
1 |
0.000 |
2 |
0.00 |
0.00 |
0.00 |
1.00 |
2.00 |
0 |
0 |
0 |
0 |
| 13 . |
Mark Grey |
2 |
0 |
0 |
0 |
1 |
0.000 |
0 |
0.00 |
0.00 |
0.00 |
0.50 |
0.00 |
0 |
0 |
0 |
0 |
| 14 . |
Bob Gruca |
2 |
0 |
0 |
0 |
2 |
0.000 |
0 |
0.00 |
0.00 |
0.00 |
1.00 |
0.00 |
0 |
0 |
0 |
0 |
| 15 . |
Andrew Guggenheim |
2 |
0 |
0 |
0 |
4 |
0.000 |
0 |
0.00 |
0.00 |
0.00 |
2.00 |
0.00 |
0 |
0 |
0 |
0 |
| 16 . |
Joseph Burgess |
2 |
0 |
0 |
0 |
3 |
0.000 |
0 |
0.00 |
0.00 |
0.00 |
1.50 |
0.00 |
0 |
0 |
0 |
0 |
| 17 . |
Bryce Connor |
2 |
0 |
0 |
0 |
6 |
0.000 |
0 |
0.00 |
0.00 |
0.00 |
3.00 |
0.00 |
0 |
0 |
0 |
0 |
| |
TOTALS |
2 |
6 |
5 |
11 |
59 |
0.102 |
10 |
3.00 |
2.50 |
5.50 |
29.50 |
5.00 |
1 |
0 |
- |
- |
Individual Goalie Statistics
|
Players |
GP |
W |
L |
T |
GAA |
PER |
SV |
SV% |
SA |
GA |
SHO |
SA1 |
GA1 |
SA2 |
GA2 |
SA3 |
GA3 |
| 1 . |
Wes Deacon G |
2 |
1 |
1 |
0 |
3.00 |
6 |
61 |
0.910 |
67 |
6 |
0 |
26 |
1 |
17 |
2 |
24 |
3 |
| |
TOTALS |
2 |
0 |
0 |
0 |
3.00 |
0 |
61 |
0.910 |
67 |
6 |
0 |
26 |
1 |
17 |
2 |
24 |
3 |
Team Record: 1 - 1 - 0 (0.500
)
Game 1
5/31
4- 3
BLACK
HOME |
Game 2
6/ 3
2- 3
WHITE
AWAY |
| Goals Scored |
Goals Allowed |
3.00
goals/game |
3.00
goals/game |
| Differential |
+0.00
goals/game |
| Power Play |
Penalty Kill |
0/ 3
power play |
4/ 4
penalty kill |
| PP% |
PK% |
0.0%
power play |
100.0%
penalty kill |
Goals by Period
Team Leaders
| Categories |
Players |
Statistics |
| GOALS |
Sean-Paul Mauro |
3 |
| ASSISTS |
Jacob Hoberman |
3 |
| TOTAL POINTS |
Jeff Deacon , Jacob Hoberman , Sean-Paul Mauro |
3 |
| SHOTS ON GOAL |
Sean-Paul Mauro |
11 |
| SHOOTING % |
Sean-Paul Mauro |
0.273 |
| HAT TRICKS |
Sean-Paul Mauro |
1 |
| PLAY MAKERS |
Sean-Paul Mauro |
0 |
| LONGEST SCORING STREAK |
Jeff Deacon |
2 |
| SHUTOUTS |
Jeff Deacon |
0 |
| GOALIE WINNING PCT. |
Wes Deacon G |
0.500 |
| GOALS AGAINST AVERAGE |
Wes Deacon G |
3.00 |
| SAVES PER GAME |
Wes Deacon G |
30.50 |
| SAVE PCT. |
Wes Deacon G |
0.910 |
Goalies need a minimum 1
games to qualify. Players need a min of 1 shot/game.
BLACK ( 0 - 1 - 0 )
Individual Team Statistics
|
Players |
GP |
G |
A |
PTS |
SOG |
SPCT |
PIM |
G/G |
A/G |
P/G |
S/G |
PIM/G |
HT |
PM |
GS |
LS |
| 1 . |
Kevin Kreshover |
1 |
0 |
2 |
2 |
4 |
0.000 |
0 |
0.00 |
2.00 |
2.00 |
4.00 |
0.00 |
0 |
0 |
0 |
0 |
| 2 . |
Nate Christman |
1 |
1 |
1 |
2 |
5 |
0.200 |
0 |
1.00 |
1.00 |
2.00 |
5.00 |
0.00 |
0 |
0 |
1 |
1 |
| 3 . |
Sub #24 |
1 |
1 |
0 |
1 |
4 |
0.250 |
4 |
1.00 |
0.00 |
1.00 |
4.00 |
4.00 |
0 |
0 |
1 |
1 |
| 4 . |
Jack Cross |
1 |
1 |
0 |
1 |
3 |
0.333 |
0 |
1.00 |
0.00 |
1.00 |
3.00 |
0.00 |
0 |
0 |
1 |
1 |
| 5 . |
Grant Passell G |
1 |
0 |
0 |
0 |
0 |
0.000 |
0 |
0.00 |
0.00 |
0.00 |
1.00 |
0.00 |
0 |
0 |
0 |
0 |
| 6 . |
Sub #23 |
1 |
0 |
0 |
0 |
2 |
0.000 |
2 |
0.00 |
0.00 |
0.00 |
2.00 |
2.00 |
0 |
0 |
0 |
0 |
| 7 . |
Steve Warshawsky |
1 |
0 |
0 |
0 |
2 |
0.000 |
0 |
0.00 |
0.00 |
0.00 |
2.00 |
0.00 |
0 |
0 |
0 |
0 |
| 8 . |
Ryan Cecchi |
1 |
0 |
0 |
0 |
1 |
0.000 |
0 |
0.00 |
0.00 |
0.00 |
1.00 |
0.00 |
0 |
0 |
0 |
0 |
| 9 . |
Josh Heyka |
1 |
0 |
0 |
0 |
2 |
0.000 |
0 |
0.00 |
0.00 |
0.00 |
2.00 |
0.00 |
0 |
0 |
0 |
0 |
| 10 . |
Mark Knaus |
1 |
0 |
0 |
0 |
2 |
0.000 |
0 |
0.00 |
0.00 |
0.00 |
2.00 |
0.00 |
0 |
0 |
0 |
0 |
| 11 . |
Ian Soble |
1 |
0 |
0 |
0 |
2 |
0.000 |
0 |
0.00 |
0.00 |
0.00 |
2.00 |
0.00 |
0 |
0 |
0 |
0 |
| |
TOTALS |
1 |
3 |
3 |
6 |
27 |
0.111 |
6 |
3.00 |
3.00 |
6.00 |
27.00 |
6.00 |
0 |
0 |
- |
- |
Individual Goalie Statistics
|
Players |
GP |
W |
L |
T |
GAA |
PER |
SV |
SV% |
SA |
GA |
SHO |
SA1 |
GA1 |
SA2 |
GA2 |
SA3 |
GA3 |
| 1 . |
Grant Passell G |
1 |
0 |
1 |
0 |
4.00 |
3 |
22 |
0.846 |
26 |
4 |
0 |
7 |
0 |
9 |
2 |
10 |
2 |
| |
TOTALS |
1 |
0 |
0 |
0 |
4.00 |
0 |
22 |
0.846 |
26 |
4 |
0 |
7 |
0 |
9 |
2 |
10 |
2 |
Team Record: 0 - 1 - 0 (0.000
)
Game 1
5/31
3- 4
BLUE
AWAY |
| Goals Scored |
Goals Allowed |
3.00
goals/game |
4.00
goals/game |
| Differential |
-1.00
goals/game |
| Power Play |
Penalty Kill |
0/ 4
power play |
2/ 2
penalty kill |
| PP% |
PK% |
0.0%
power play |
100.0%
penalty kill |
Goals by Period
Team Leaders
| Categories |
Players |
Statistics |
| GOALS |
Jack Cross , Nate Christman , Sub #24 |
1 |
| ASSISTS |
Kevin Kreshover |
2 |
| TOTAL POINTS |
Kevin Kreshover , Nate Christman |
2 |
| SHOTS ON GOAL |
Nate Christman |
5 |
| SHOOTING % |
Jack Cross |
0.333 |
| HAT TRICKS |
Jack Cross |
0 |
| PLAY MAKERS |
Jack Cross |
0 |
| LONGEST SCORING STREAK |
Jack Cross , Nate Christman , Sub #24 |
1 |
| SHUTOUTS |
Jack Cross |
0 |
| GOALIE WINNING PCT. |
Jack Cross |
***** |
| GOALS AGAINST AVERAGE |
Grant Passell G |
4.00 |
| SAVES PER GAME |
Grant Passell G |
22.00 |
| SAVE PCT. |
Grant Passell G |
0.846 |
Goalies need a minimum 0
games to qualify. Players need a min of 1 shot/game.
GREEN ( 0 - 1 - 0 )
Individual Team Statistics
|
Players |
GP |
G |
A |
PTS |
SOG |
SPCT |
PIM |
G/G |
A/G |
P/G |
S/G |
PIM/G |
HT |
PM |
GS |
LS |
| 1 . |
Brian Stovsky |
1 |
3 |
1 |
4 |
7 |
0.429 |
0 |
3.00 |
1.00 |
4.00 |
7.00 |
0.00 |
1 |
0 |
1 |
1 |
| 2 . |
Branden Henning |
1 |
0 |
3 |
3 |
4 |
0.000 |
0 |
0.00 |
3.00 |
3.00 |
4.00 |
0.00 |
0 |
1 |
0 |
0 |
| 3 . |
Adam Reisig |
1 |
0 |
1 |
1 |
2 |
0.000 |
0 |
0.00 |
1.00 |
1.00 |
2.00 |
0.00 |
0 |
0 |
0 |
0 |
| 4 . |
Mike Fellenbaum |
1 |
1 |
0 |
1 |
3 |
0.333 |
0 |
1.00 |
0.00 |
1.00 |
3.00 |
0.00 |
0 |
0 |
1 |
1 |
| 5 . |
Jeff Gould |
1 |
0 |
1 |
1 |
2 |
0.000 |
0 |
0.00 |
1.00 |
1.00 |
2.00 |
0.00 |
0 |
0 |
0 |
0 |
| 6 . |
Reid Anderson |
1 |
0 |
1 |
1 |
3 |
0.000 |
0 |
0.00 |
1.00 |
1.00 |
3.00 |
0.00 |
0 |
0 |
0 |
0 |
| 7 . |
Brian O'Neill |
1 |
0 |
1 |
1 |
2 |
0.000 |
0 |
0.00 |
1.00 |
1.00 |
2.00 |
0.00 |
0 |
0 |
0 |
0 |
| 8 . |
Dave Kresnye G |
1 |
0 |
0 |
0 |
0 |
0.000 |
0 |
0.00 |
0.00 |
0.00 |
1.00 |
0.00 |
0 |
0 |
0 |
0 |
| 9 . |
Joe Ferguson |
1 |
0 |
0 |
0 |
2 |
0.000 |
0 |
0.00 |
0.00 |
0.00 |
2.00 |
0.00 |
0 |
0 |
0 |
0 |
| 10 . |
Ryan Brown |
1 |
0 |
0 |
0 |
2 |
0.000 |
0 |
0.00 |
0.00 |
0.00 |
2.00 |
0.00 |
0 |
0 |
0 |
0 |
| |
TOTALS |
1 |
4 |
8 |
12 |
27 |
0.148 |
0 |
4.00 |
8.00 |
12.00 |
27.00 |
0.00 |
1 |
1 |
- |
- |
Individual Goalie Statistics
|
Players |
GP |
W |
L |
T |
GAA |
PER |
SV |
SV% |
SA |
GA |
SHO |
SA1 |
GA1 |
SA2 |
GA2 |
SA3 |
GA3 |
| 1 . |
Dave Kresnye G |
1 |
0 |
1 |
0 |
5.00 |
3 |
22 |
0.815 |
27 |
5 |
0 |
10 |
2 |
7 |
0 |
10 |
3 |
| |
TOTALS |
1 |
0 |
0 |
0 |
5.00 |
0 |
22 |
0.815 |
27 |
5 |
0 |
10 |
2 |
7 |
0 |
10 |
3 |
Team Record: 0 - 1 - 0 (0.000
)
Game 1
5/31
4- 5
RED
HOME |
| Goals Scored |
Goals Allowed |
4.00
goals/game |
5.00
goals/game |
| Differential |
-1.00
goals/game |
| Power Play |
Penalty Kill |
0/ 0
power play |
0/ 0
penalty kill |
| PP% |
PK% |
0.0%
power play |
0.0%
penalty kill |
Goals by Period
Team Leaders
| Categories |
Players |
Statistics |
| GOALS |
Brian Stovsky |
3 |
| ASSISTS |
Branden Henning |
3 |
| TOTAL POINTS |
Brian Stovsky |
4 |
| SHOTS ON GOAL |
Brian Stovsky |
7 |
| SHOOTING % |
Brian Stovsky |
0.429 |
| HAT TRICKS |
Brian Stovsky |
1 |
| PLAY MAKERS |
Branden Henning |
1 |
| LONGEST SCORING STREAK |
Mike Fellenbaum , Brian Stovsky |
1 |
| SHUTOUTS |
Mike Fellenbaum |
0 |
| GOALIE WINNING PCT. |
Mike Fellenbaum |
***** |
| GOALS AGAINST AVERAGE |
Dave Kresnye G |
5.00 |
| SAVES PER GAME |
Dave Kresnye G |
22.00 |
| SAVE PCT. |
Dave Kresnye G |
0.815 |
Goalies need a minimum 0
games to qualify. Players need a min of 1 shot/game.
WHITE ( 1 - 1 - 0 )
Individual Team Statistics
|
Players |
GP |
G |
A |
PTS |
SOG |
SPCT |
PIM |
G/G |
A/G |
P/G |
S/G |
PIM/G |
HT |
PM |
GS |
LS |
| 1 . |
Connor Braid |
2 |
1 |
3 |
4 |
9 |
0.111 |
2 |
0.50 |
1.50 |
2.00 |
4.50 |
1.00 |
0 |
0 |
1 |
1 |
| 2 . |
Zach Richterman |
2 |
1 |
2 |
3 |
17 |
0.059 |
0 |
0.50 |
1.00 |
1.50 |
8.50 |
0.00 |
0 |
0 |
1 |
1 |
| 3 . |
Anthony Bokar |
2 |
0 |
2 |
2 |
8 |
0.000 |
0 |
0.00 |
1.00 |
1.00 |
4.00 |
0.00 |
0 |
0 |
0 |
0 |
| 4 . |
Ed Stepanyants |
2 |
2 |
0 |
2 |
5 |
0.400 |
0 |
1.00 |
0.00 |
1.00 |
2.50 |
0.00 |
0 |
0 |
2 |
2 |
| 5 . |
Zach Workman |
2 |
1 |
0 |
1 |
4 |
0.250 |
2 |
0.50 |
0.00 |
0.50 |
2.00 |
1.00 |
0 |
0 |
0 |
1 |
| 6 . |
Evan Nolan |
2 |
0 |
1 |
1 |
2 |
0.000 |
0 |
0.00 |
0.50 |
0.50 |
1.00 |
0.00 |
0 |
0 |
0 |
0 |
| 7 . |
Ryan Pinson |
2 |
1 |
0 |
1 |
5 |
0.200 |
0 |
0.50 |
0.00 |
0.50 |
2.50 |
0.00 |
0 |
0 |
0 |
1 |
| 8 . |
Ryan Mayhugh |
2 |
0 |
1 |
1 |
2 |
0.000 |
2 |
0.00 |
0.50 |
0.50 |
1.00 |
1.00 |
0 |
0 |
0 |
0 |
| 9 . |
Glenn Shtarkman |
2 |
1 |
0 |
1 |
2 |
0.500 |
0 |
0.50 |
0.00 |
0.50 |
1.00 |
0.00 |
0 |
0 |
1 |
1 |
| 10 . |
Logan Mears |
2 |
1 |
0 |
1 |
6 |
0.167 |
0 |
0.50 |
0.00 |
0.50 |
3.00 |
0.00 |
0 |
0 |
1 |
1 |
| 11 . |
Justin Wolf |
2 |
0 |
0 |
0 |
3 |
0.000 |
0 |
0.00 |
0.00 |
0.00 |
1.50 |
0.00 |
0 |
0 |
0 |
0 |
| 12 . |
Ripley Crosley G |
1 |
0 |
0 |
0 |
0 |
0.000 |
0 |
0.00 |
0.00 |
0.00 |
1.00 |
0.00 |
0 |
0 |
0 |
0 |
| 13 . |
Greg Geldart G Su |
1 |
0 |
0 |
0 |
0 |
0.000 |
0 |
0.00 |
0.00 |
0.00 |
1.00 |
0.00 |
0 |
0 |
0 |
0 |
| 14 . |
Greyson Rusher |
2 |
0 |
0 |
0 |
4 |
0.000 |
0 |
0.00 |
0.00 |
0.00 |
2.00 |
0.00 |
0 |
0 |
0 |
0 |
| 15 . |
Nate Schatzman |
2 |
0 |
0 |
0 |
3 |
0.000 |
0 |
0.00 |
0.00 |
0.00 |
1.50 |
0.00 |
0 |
0 |
0 |
0 |
| 16 . |
Noah Leavitt |
2 |
0 |
0 |
0 |
1 |
0.000 |
0 |
0.00 |
0.00 |
0.00 |
0.50 |
0.00 |
0 |
0 |
0 |
0 |
| 17 . |
John Koppitch |
2 |
0 |
0 |
0 |
1 |
0.000 |
0 |
0.00 |
0.00 |
0.00 |
0.50 |
0.00 |
0 |
0 |
0 |
0 |
| |
TOTALS |
2 |
8 |
9 |
17 |
72 |
0.111 |
6 |
4.00 |
4.50 |
8.50 |
36.00 |
3.00 |
0 |
0 |
- |
- |
Individual Goalie Statistics
|
Players |
GP |
W |
L |
T |
GAA |
PER |
SV |
SV% |
SA |
GA |
SHO |
SA1 |
GA1 |
SA2 |
GA2 |
SA3 |
GA3 |
| 1 . |
Ripley Crosley G |
1 |
1 |
0 |
0 |
2.00 |
3 |
30 |
0.938 |
32 |
2 |
0 |
8 |
0 |
13 |
2 |
11 |
0 |
| 2 . |
Greg Geldart G Su |
1 |
0 |
1 |
0 |
6.00 |
3 |
23 |
0.793 |
29 |
6 |
0 |
9 |
1 |
12 |
4 |
8 |
1 |
| |
TOTALS |
2 |
0 |
0 |
0 |
4.00 |
0 |
53 |
0.869 |
61 |
8 |
0 |
17 |
1 |
25 |
6 |
19 |
1 |
Team Record: 1 - 1 - 0 (0.500
)
Game 1
6/ 3
3- 2
BLUE
HOME |
Game 2
6/ 4
5- 6
YELLOW
AWAY |
| Goals Scored |
Goals Allowed |
4.00
goals/game |
4.00
goals/game |
| Differential |
+0.00
goals/game |
| Power Play |
Penalty Kill |
2/ 3
power play |
1/ 2
penalty kill |
| PP% |
PK% |
66.7%
power play |
50.0%
penalty kill |
Goals by Period
Team Leaders
| Categories |
Players |
Statistics |
| GOALS |
Ed Stepanyants |
2 |
| ASSISTS |
Connor Braid |
3 |
| TOTAL POINTS |
Connor Braid |
4 |
| SHOTS ON GOAL |
Zach Richterman |
17 |
| SHOOTING % |
Glenn Shtarkman |
0.500 |
| HAT TRICKS |
Glenn Shtarkman |
0 |
| PLAY MAKERS |
Glenn Shtarkman |
0 |
| LONGEST SCORING STREAK |
Ed Stepanyants |
2 |
| SHUTOUTS |
Ed Stepanyants |
0 |
| GOALIE WINNING PCT. |
Ripley Crosley G |
1.000 |
| GOALS AGAINST AVERAGE |
Ripley Crosley G |
2.00 |
| SAVES PER GAME |
Ripley Crosley G |
30.00 |
| SAVE PCT. |
Ripley Crosley G |
0.938 |
Goalies need a minimum 1
games to qualify. Players need a min of 1 shot/game.
YELLOW ( 2 - 0 - 0 )
Individual Team Statistics
|
Players |
GP |
G |
A |
PTS |
SOG |
SPCT |
PIM |
G/G |
A/G |
P/G |
S/G |
PIM/G |
HT |
PM |
GS |
LS |
| 1 . |
Payton Fogarty |
2 |
8 |
3 |
11 |
17 |
0.471 |
2 |
4.00 |
1.50 |
5.50 |
8.50 |
1.00 |
2 |
0 |
2 |
2 |
| 2 . |
Bradley Forward |
2 |
1 |
3 |
4 |
6 |
0.167 |
0 |
0.50 |
1.50 |
2.00 |
3.00 |
0.00 |
0 |
0 |
0 |
1 |
| 3 . |
John Rutter |
2 |
0 |
2 |
2 |
4 |
0.000 |
2 |
0.00 |
1.00 |
1.00 |
2.00 |
1.00 |
0 |
0 |
0 |
0 |
| 4 . |
Mike Borden |
2 |
1 |
1 |
2 |
5 |
0.200 |
0 |
0.50 |
0.50 |
1.00 |
2.50 |
0.00 |
0 |
0 |
0 |
1 |
| 5 . |
Bill Scanlon |
2 |
0 |
1 |
1 |
2 |
0.000 |
0 |
0.00 |
0.50 |
0.50 |
1.00 |
0.00 |
0 |
0 |
0 |
0 |
| 6 . |
BJ Solaru |
2 |
1 |
0 |
1 |
4 |
0.250 |
0 |
0.50 |
0.00 |
0.50 |
2.00 |
0.00 |
0 |
0 |
0 |
1 |
| 7 . |
Sean Collings |
2 |
1 |
0 |
1 |
3 |
0.333 |
2 |
0.50 |
0.00 |
0.50 |
1.50 |
1.00 |
0 |
0 |
1 |
1 |
| 8 . |
Brandon Detzel |
2 |
0 |
1 |
1 |
3 |
0.000 |
2 |
0.00 |
0.50 |
0.50 |
1.50 |
1.00 |
0 |
0 |
0 |
0 |
| 9 . |
Eric Kluger |
2 |
1 |
0 |
1 |
3 |
0.333 |
2 |
0.50 |
0.00 |
0.50 |
1.50 |
1.00 |
0 |
0 |
1 |
1 |
| 10 . |
Pat Miller |
2 |
0 |
1 |
1 |
3 |
0.000 |
0 |
0.00 |
0.50 |
0.50 |
1.50 |
0.00 |
0 |
0 |
0 |
0 |
| 11 . |
Brooke Nicholson |
2 |
1 |
0 |
1 |
3 |
0.333 |
0 |
0.50 |
0.00 |
0.50 |
1.50 |
0.00 |
0 |
0 |
0 |
1 |
| 12 . |
Jon Rice |
2 |
0 |
1 |
1 |
3 |
0.000 |
0 |
0.00 |
0.50 |
0.50 |
1.50 |
0.00 |
0 |
0 |
0 |
0 |
| 13 . |
Yi Yang Goalie |
2 |
0 |
0 |
0 |
0 |
0.000 |
0 |
0.00 |
0.00 |
0.00 |
0.50 |
0.00 |
0 |
0 |
0 |
0 |
| 14 . |
Jeff Hammel |
2 |
0 |
0 |
0 |
3 |
0.000 |
0 |
0.00 |
0.00 |
0.00 |
1.50 |
0.00 |
0 |
0 |
0 |
0 |
| 15 . |
Joe Bowman |
2 |
0 |
0 |
0 |
2 |
0.000 |
4 |
0.00 |
0.00 |
0.00 |
1.00 |
2.00 |
0 |
0 |
0 |
0 |
| |
TOTALS |
2 |
14 |
13 |
27 |
61 |
0.230 |
14 |
7.00 |
6.50 |
13.50 |
30.50 |
7.00 |
2 |
0 |
- |
- |
Individual Goalie Statistics
|
Players |
GP |
W |
L |
T |
GAA |
PER |
SV |
SV% |
SA |
GA |
SHO |
SA1 |
GA1 |
SA2 |
GA2 |
SA3 |
GA3 |
| 1 . |
Yi Yang Goalie |
2 |
2 |
0 |
0 |
4.00 |
6 |
44 |
0.846 |
52 |
8 |
0 |
16 |
2 |
18 |
3 |
18 |
3 |
| |
TOTALS |
2 |
0 |
0 |
0 |
4.00 |
0 |
44 |
0.846 |
52 |
8 |
0 |
16 |
2 |
18 |
3 |
18 |
3 |
Team Record: 2 - 0 - 0 (1.000
)
Game 1
6/ 2
8- 3
RED
HOME |
Game 2
6/ 4
6- 5
WHITE
HOME |
| Goals Scored |
Goals Allowed |
7.00
goals/game |
4.00
goals/game |
| Differential |
+3.00
goals/game |
| Power Play |
Penalty Kill |
1/ 2
power play |
4/ 6
penalty kill |
| PP% |
PK% |
50.0%
power play |
66.7%
penalty kill |
Goals by Period
Team Leaders
| Categories |
Players |
Statistics |
| GOALS |
Payton Fogarty |
8 |
| ASSISTS |
Payton Fogarty , Bradley Forward |
3 |
| TOTAL POINTS |
Payton Fogarty |
11 |
| SHOTS ON GOAL |
Payton Fogarty |
17 |
| SHOOTING % |
Payton Fogarty |
0.471 |
| HAT TRICKS |
Payton Fogarty |
2 |
| PLAY MAKERS |
Payton Fogarty |
0 |
| LONGEST SCORING STREAK |
Payton Fogarty |
2 |
| SHUTOUTS |
Payton Fogarty |
0 |
| GOALIE WINNING PCT. |
Yi Yang Goalie |
1.000 |
| GOALS AGAINST AVERAGE |
Yi Yang Goalie |
4.00 |
| SAVES PER GAME |
Yi Yang Goalie |
22.00 |
| SAVE PCT. |
Yi Yang Goalie |
0.846 |
Goalies need a minimum 1
games to qualify. Players need a min of 1 shot/game.
RED ( 1 - 1 - 0 )
Individual Team Statistics
|
Players |
GP |
G |
A |
PTS |
SOG |
SPCT |
PIM |
G/G |
A/G |
P/G |
S/G |
PIM/G |
HT |
PM |
GS |
LS |
| 1 . |
Josh Baraona |
2 |
3 |
2 |
5 |
10 |
0.300 |
0 |
1.50 |
1.00 |
2.50 |
5.00 |
0.00 |
0 |
0 |
2 |
2 |
| 2 . |
Justin Vance |
2 |
4 |
1 |
5 |
9 |
0.444 |
0 |
2.00 |
0.50 |
2.50 |
4.50 |
0.00 |
1 |
0 |
2 |
2 |
| 3 . |
Matt Bartley |
2 |
0 |
2 |
2 |
5 |
0.000 |
0 |
0.00 |
1.00 |
1.00 |
2.50 |
0.00 |
0 |
0 |
0 |
0 |
| 4 . |
Andy Wisniewski |
2 |
0 |
1 |
1 |
4 |
0.000 |
0 |
0.00 |
0.50 |
0.50 |
2.00 |
0.00 |
0 |
0 |
0 |
0 |
| 5 . |
Brian Bradley |
2 |
1 |
0 |
1 |
4 |
0.250 |
0 |
0.50 |
0.00 |
0.50 |
2.00 |
0.00 |
0 |
0 |
1 |
1 |
| 6 . |
Charles Huse |
2 |
0 |
1 |
1 |
3 |
0.000 |
0 |
0.00 |
0.50 |
0.50 |
1.50 |
0.00 |
0 |
0 |
0 |
0 |
| 7 . |
Matt Bachocvchin |
2 |
0 |
1 |
1 |
3 |
0.000 |
0 |
0.00 |
0.50 |
0.50 |
1.50 |
0.00 |
0 |
0 |
0 |
0 |
| 8 . |
Colin McCloskey G |
2 |
0 |
0 |
0 |
0 |
0.000 |
0 |
0.00 |
0.00 |
0.00 |
0.50 |
0.00 |
0 |
0 |
0 |
0 |
| 9 . |
Adam Burgener |
2 |
0 |
0 |
0 |
2 |
0.000 |
2 |
0.00 |
0.00 |
0.00 |
1.00 |
1.00 |
0 |
0 |
0 |
0 |
| 10 . |
Brendan Lucas |
2 |
0 |
0 |
0 |
2 |
0.000 |
0 |
0.00 |
0.00 |
0.00 |
1.00 |
0.00 |
0 |
0 |
0 |
0 |
| 11 . |
Mike Metzler |
2 |
0 |
0 |
0 |
2 |
0.000 |
0 |
0.00 |
0.00 |
0.00 |
1.00 |
0.00 |
0 |
0 |
0 |
0 |
| 12 . |
Breana Siljander |
1 |
0 |
0 |
0 |
2 |
0.000 |
0 |
0.00 |
0.00 |
0.00 |
2.00 |
0.00 |
0 |
0 |
0 |
0 |
| 13 . |
Scott Consaul |
2 |
0 |
0 |
0 |
4 |
0.000 |
0 |
0.00 |
0.00 |
0.00 |
2.00 |
0.00 |
0 |
0 |
0 |
0 |
| |
TOTALS |
2 |
8 |
8 |
16 |
50 |
0.160 |
2 |
4.00 |
4.00 |
8.00 |
25.00 |
1.00 |
1 |
0 |
- |
- |
Individual Goalie Statistics
|
Players |
GP |
W |
L |
T |
GAA |
PER |
SV |
SV% |
SA |
GA |
SHO |
SA1 |
GA1 |
SA2 |
GA2 |
SA3 |
GA3 |
| 1 . |
Colin McCloskey G |
2 |
1 |
1 |
0 |
6.00 |
6 |
47 |
0.797 |
59 |
12 |
0 |
21 |
5 |
21 |
5 |
17 |
2 |
| |
TOTALS |
2 |
0 |
0 |
0 |
6.00 |
0 |
47 |
0.797 |
59 |
12 |
0 |
21 |
5 |
21 |
5 |
17 |
2 |
Team Record: 1 - 1 - 0 (0.500
)
Game 1
5/31
5- 4
GREEN
AWAY |
Game 2
6/ 2
3- 8
YELLOW
AWAY |
| Goals Scored |
Goals Allowed |
4.00
goals/game |
6.00
goals/game |
| Differential |
-2.00
goals/game |
| Power Play |
Penalty Kill |
0/ 3
power play |
1/ 1
penalty kill |
| PP% |
PK% |
0.0%
power play |
100.0%
penalty kill |
Goals by Period
Team Leaders
| Categories |
Players |
Statistics |
| GOALS |
Justin Vance |
4 |
| ASSISTS |
Josh Baraona , Matt Bartley |
2 |
| TOTAL POINTS |
Josh Baraona , Justin Vance |
5 |
| SHOTS ON GOAL |
Josh Baraona |
10 |
| SHOOTING % |
Justin Vance |
0.444 |
| HAT TRICKS |
Justin Vance |
1 |
| PLAY MAKERS |
Justin Vance |
0 |
| LONGEST SCORING STREAK |
Josh Baraona , Justin Vance |
2 |
| SHUTOUTS |
Josh Baraona |
0 |
| GOALIE WINNING PCT. |
Colin McCloskey G |
0.500 |
| GOALS AGAINST AVERAGE |
Colin McCloskey G |
6.00 |
| SAVES PER GAME |
Colin McCloskey G |
23.50 |
| SAVE PCT. |
Colin McCloskey G |
0.797 |
Goalies need a minimum 1
games to qualify. Players need a min of 1 shot/game.
Team Standings
6/ 4/26 | PRINTOUT #: 1
| Teams |
GP |
W |
L |
T |
GS/G |
GA/G |
GD/G |
PCT |
LWS |
PS |
PTS |
| 1. YELLOW |
2 |
2 |
0 |
0 |
7.0 |
4.0 |
+3.0 |
1.000 |
2 |
2W |
4 |
| 2. WHITE |
2 |
1 |
1 |
0 |
4.0 |
4.0 |
+0.0 |
0.500 |
1 |
1L |
2 |
| 3. BLUE |
2 |
1 |
1 |
0 |
3.0 |
3.0 |
+0.0 |
0.500 |
1 |
1L |
2 |
| 4. RED |
2 |
1 |
1 |
0 |
4.0 |
6.0 |
-2.0 |
0.500 |
1 |
1L |
2 |
| 5. GREEN |
1 |
0 |
1 |
0 |
4.0 |
5.0 |
-1.0 |
0.000 |
0 |
1L |
0 |
| 6. BLACK |
1 |
0 |
1 |
0 |
3.0 |
4.0 |
-1.0 |
0.000 |
0 |
1L |
0 |
Back to Top Team Statistics
| TEAMS |
GP |
GS |
GA |
A |
PTS |
HT |
PM |
PIM |
PIM/G |
PP |
PP% |
PK |
PK% |
SHG |
SV |
SA |
SV% |
| 1. YELLOW |
2 |
14
|
8
|
13
|
27
|
2 |
0 |
14 |
7.0 |
1 / 2 |
50.0% |
4 / 6 |
66.7% |
1 |
44
|
52
|
0.846
|
| 2. WHITE |
2 |
8
|
8
|
9
|
17
|
0 |
0 |
6 |
3.0 |
2 / 3 |
66.7% |
1 / 2 |
50.0% |
0 |
53
|
61
|
0.869
|
| 3. RED |
2 |
8
|
12
|
8
|
16
|
1 |
0 |
2 |
1.0 |
0 / 3 |
0.0% |
1 / 1 |
100.0% |
0 |
47
|
59
|
0.797
|
| 4. BLUE |
2 |
6
|
6
|
5
|
11
|
1 |
0 |
10 |
5.0 |
0 / 3 |
0.0% |
4 / 4 |
100.0% |
1 |
61
|
67
|
0.910
|
| 5. GREEN |
1 |
4
|
5
|
8
|
12
|
1 |
1 |
0 |
0.0 |
0 / 0 |
0.0% |
0 / 0 |
0.0% |
0 |
22
|
27
|
0.815
|
| 6. BLACK |
1 |
3
|
4
|
3
|
6
|
0 |
0 |
6 |
6.0 |
0 / 4 |
0.0% |
2 / 2 |
100.0% |
1 |
22
|
26
|
0.846
|
Back to Top
Individual League Leaders
Goals
|
Players |
Team |
GP |
G |
G/GP |
| 1. |
Payton Fogarty |
YELLOW |
2
|
8
|
4.00
|
| 2. |
Justin Vance |
RED |
2
|
4
|
2.00
|
| 3. |
Sean-Paul Mauro |
BLUE |
2
|
3
|
1.50
|
| 4. |
Josh Baraona |
RED |
2
|
3
|
1.50
|
| 5. |
Brian Stovsky |
GREEN |
1
|
3
|
3.00
|
| 6. |
Ed Stepanyants |
WHITE |
2
|
2
|
1.00
|
| 7. |
Jeff Deacon |
BLUE |
2
|
2
|
1.00
|
| 8. |
Glenn Shtarkman |
WHITE |
2
|
1
|
0.50
|
| 9. |
Ryan Pinson |
WHITE |
2
|
1
|
0.50
|
| 10. |
Zach Workman |
WHITE |
2
|
1
|
0.50
|
| 11. |
Mike Borden |
YELLOW |
2
|
1
|
0.50
|
| 12. |
Sean Collings |
YELLOW |
2
|
1
|
0.50
|
| 13. |
Zach Richterman |
WHITE |
2
|
1
|
0.50
|
| 14. |
Bradley Forward |
YELLOW |
2
|
1
|
0.50
|
| 15. |
Eric Kluger |
YELLOW |
2
|
1
|
0.50
|
| 16. |
Sub #24 |
BLACK |
1
|
1
|
1.00
|
| 17. |
Mike Fellenbaum |
GREEN |
1
|
1
|
1.00
|
| 18. |
Nate Christman |
BLACK |
1
|
1
|
1.00
|
| 19. |
Connor Braid |
WHITE |
2
|
1
|
0.50
|
| 20. |
Logan Mears |
WHITE |
2
|
1
|
0.50
|
Back to Top Assists
|
Players |
Team |
GP |
A |
A/GP |
| 1. |
Connor Braid |
WHITE |
2
|
3
|
1.50
|
| 2. |
Payton Fogarty |
YELLOW |
2
|
3
|
1.50
|
| 3. |
Bradley Forward |
YELLOW |
2
|
3
|
1.50
|
| 4. |
Jacob Hoberman |
BLUE |
2
|
3
|
1.50
|
| 5. |
Branden Henning |
GREEN |
1
|
3
|
3.00
|
| 6. |
Anthony Bokar |
WHITE |
2
|
2
|
1.00
|
| 7. |
Zach Richterman |
WHITE |
2
|
2
|
1.00
|
| 8. |
Kevin Kreshover |
BLACK |
1
|
2
|
2.00
|
| 9. |
Josh Baraona |
RED |
2
|
2
|
1.00
|
| 10. |
Matt Bartley |
RED |
2
|
2
|
1.00
|
| 11. |
John Rutter |
YELLOW |
2
|
2
|
1.00
|
| 12. |
Brian Stovsky |
GREEN |
1
|
1
|
1.00
|
| 13. |
Mike Borden |
YELLOW |
2
|
1
|
0.50
|
| 14. |
Brandon Detzel |
YELLOW |
2
|
1
|
0.50
|
| 15. |
Ryan Mayhugh |
WHITE |
2
|
1
|
0.50
|
| 16. |
Evan Nolan |
WHITE |
2
|
1
|
0.50
|
| 17. |
Jeff Gould |
GREEN |
1
|
1
|
1.00
|
| 18. |
Reid Anderson |
GREEN |
1
|
1
|
1.00
|
| 19. |
Brian O'Neill |
GREEN |
1
|
1
|
1.00
|
| 20. |
Adam Reisig |
GREEN |
1
|
1
|
1.00
|
Back to Top Points
|
Players |
Team |
GP |
G |
A |
P |
P/GP |
| 1. |
Payton Fogarty |
YELLOW |
2
|
8
|
3
|
11
|
5.50
|
| 2. |
Josh Baraona |
RED |
2
|
3
|
2
|
5
|
2.50
|
| 3. |
Justin Vance |
RED |
2
|
4
|
1
|
5
|
2.50
|
| 4. |
Connor Braid |
WHITE |
2
|
1
|
3
|
4
|
2.00
|
| 5. |
Brian Stovsky |
GREEN |
1
|
3
|
1
|
4
|
4.00
|
| 6. |
Bradley Forward |
YELLOW |
2
|
1
|
3
|
4
|
2.00
|
| 7. |
Zach Richterman |
WHITE |
2
|
1
|
2
|
3
|
1.50
|
| 8. |
Jacob Hoberman |
BLUE |
2
|
0
|
3
|
3
|
1.50
|
| 9. |
Sean-Paul Mauro |
BLUE |
2
|
3
|
0
|
3
|
1.50
|
| 10. |
Jeff Deacon |
BLUE |
2
|
2
|
1
|
3
|
1.50
|
| 11. |
Branden Henning |
GREEN |
1
|
0
|
3
|
3
|
3.00
|
| 12. |
Ed Stepanyants |
WHITE |
2
|
2
|
0
|
2
|
1.00
|
| 13. |
Mike Borden |
YELLOW |
2
|
1
|
1
|
2
|
1.00
|
| 14. |
Anthony Bokar |
WHITE |
2
|
0
|
2
|
2
|
1.00
|
| 15. |
John Rutter |
YELLOW |
2
|
0
|
2
|
2
|
1.00
|
| 16. |
Matt Bartley |
RED |
2
|
0
|
2
|
2
|
1.00
|
| 17. |
Kevin Kreshover |
BLACK |
1
|
0
|
2
|
2
|
2.00
|
| 18. |
Nate Christman |
BLACK |
1
|
1
|
1
|
2
|
2.00
|
| 19. |
Ryan Mayhugh |
WHITE |
2
|
0
|
1
|
1
|
0.50
|
| 20. |
Glenn Shtarkman |
WHITE |
2
|
1
|
0
|
1
|
0.50
|
| 21. |
Logan Mears |
WHITE |
2
|
1
|
0
|
1
|
0.50
|
| 22. |
Zach Workman |
WHITE |
2
|
1
|
0
|
1
|
0.50
|
| 23. |
Evan Nolan |
WHITE |
2
|
0
|
1
|
1
|
0.50
|
| 24. |
Sean Collings |
YELLOW |
2
|
1
|
0
|
1
|
0.50
|
| 25. |
Brandon Detzel |
YELLOW |
2
|
0
|
1
|
1
|
0.50
|
| 26. |
Ryan Pinson |
WHITE |
2
|
1
|
0
|
1
|
0.50
|
| 27. |
Jeff Gould |
GREEN |
1
|
0
|
1
|
1
|
1.00
|
| 28. |
Mike Fellenbaum |
GREEN |
1
|
1
|
0
|
1
|
1.00
|
| 29. |
Brian O'Neill |
GREEN |
1
|
0
|
1
|
1
|
1.00
|
| 30. |
Adam Reisig |
GREEN |
1
|
0
|
1
|
1
|
1.00
|
Back to Top
Shots On Goal
|
Players |
Team |
GP |
S |
S% |
S/GP |
| 1. |
Zach Richterman |
WHITE |
2
|
17
|
0.059
|
8.50
|
| 2. |
Payton Fogarty |
YELLOW |
2
|
17
|
0.471
|
8.50
|
| 3. |
Sean-Paul Mauro |
BLUE |
2
|
11
|
0.273
|
5.50
|
| 4. |
Josh Baraona |
RED |
2
|
10
|
0.300
|
5.00
|
| 5. |
Jeff Deacon |
BLUE |
2
|
10
|
0.200
|
5.00
|
| 6. |
Justin Vance |
RED |
2
|
9
|
0.444
|
4.50
|
| 7. |
Connor Braid |
WHITE |
2
|
9
|
0.111
|
4.50
|
| 8. |
Anthony Bokar |
WHITE |
2
|
8
|
0.000
|
4.00
|
| 9. |
Brian Stovsky |
GREEN |
1
|
7
|
0.429
|
7.00
|
| 10. |
Bradley Forward |
YELLOW |
2
|
6
|
0.167
|
3.00
|
| 11. |
Bryce Connor |
BLUE |
2
|
6
|
0.000
|
3.00
|
| 12. |
Logan Mears |
WHITE |
2
|
6
|
0.167
|
3.00
|
| 13. |
Mike Borden |
YELLOW |
2
|
5
|
0.200
|
2.50
|
| 14. |
Jacob Hoberman |
BLUE |
2
|
5
|
0.000
|
2.50
|
| 15. |
Ryan Pinson |
WHITE |
2
|
5
|
0.200
|
2.50
|
| 16. |
Dan Bacon |
BLUE |
2
|
5
|
0.000
|
2.50
|
| 17. |
Matt Bartley |
RED |
2
|
5
|
0.000
|
2.50
|
| 18. |
Nate Christman |
BLACK |
1
|
5
|
0.200
|
5.00
|
| 19. |
Ed Stepanyants |
WHITE |
2
|
5
|
0.400
|
2.50
|
| 20. |
Greyson Rusher |
WHITE |
2
|
4
|
0.000
|
2.00
|
Back to Top
Penalty Minutes
|
Players |
Team |
GP |
PIM |
PIM/GP |
| 1. |
Joe Bowman |
YELLOW |
2
|
4
|
2.00
|
| 2. |
Jeff Deacon |
BLUE |
2
|
4
|
2.00
|
| 3. |
Sub #9 |
BLUE |
1
|
4
|
4.00
|
| 4. |
Sub #24 |
BLACK |
1
|
4
|
4.00
|
| 5. |
Sean Collings |
YELLOW |
2
|
2
|
1.00
|
| 6. |
Brandon Detzel |
YELLOW |
2
|
2
|
1.00
|
| 7. |
Payton Fogarty |
YELLOW |
2
|
2
|
1.00
|
| 8. |
Eric Kluger |
YELLOW |
2
|
2
|
1.00
|
| 9. |
John Rutter |
YELLOW |
2
|
2
|
1.00
|
| 10. |
Adam Burgener |
RED |
2
|
2
|
1.00
|
| 11. |
Sub #23 |
BLACK |
1
|
2
|
2.00
|
| 12. |
Ryan Dee |
BLUE |
1
|
2
|
2.00
|
| 13. |
Connor Braid |
WHITE |
2
|
2
|
1.00
|
| 14. |
Ryan Mayhugh |
WHITE |
2
|
2
|
1.00
|
| 15. |
Zach Workman |
WHITE |
2
|
2
|
1.00
|
Back to Top Hat Tricks
|
Players |
Team |
GP |
HT |
HT/GP |
| 1. |
Payton Fogarty |
YELLOW |
2
|
2
|
1.00
|
| 2. |
Justin Vance |
RED |
2
|
1
|
0.50
|
| 3. |
Sean-Paul Mauro |
BLUE |
2
|
1
|
0.50
|
| 4. |
Brian Stovsky |
GREEN |
1
|
1
|
1.00
|
Back to Top Playmakers
|
Players |
Team |
GP |
PM |
PM/GP |
| 1. |
Branden Henning |
GREEN |
1
|
1
|
1.00
|
Back to Top
Goals Against Average
|
Players |
Team |
GP |
GA |
GAA |
| 1. |
Ripley Crosley G |
WHITE |
1
|
2
|
2.00
|
| 2. |
Wes Deacon G |
BLUE |
2
|
6
|
3.00
|
| 3. |
Grant Passell G |
BLACK |
1
|
4
|
4.00
|
| 4. |
Yi Yang Goalie |
YELLOW |
2
|
8
|
4.00
|
Back to Top Shutouts
Back to Top
Goalie Winning %
|
Players |
Team |
GP |
W |
L |
T |
PCT |
| 1. |
Ripley Crosley G |
WHITE |
1 |
1 |
0 |
0 |
1.000
|
| 2. |
Yi Yang Goalie |
YELLOW |
2 |
2 |
0 |
0 |
1.000
|
| 3. |
Wes Deacon G |
BLUE |
2 |
1 |
1 |
0 |
0.500
|
| 4. |
Colin McCloskey G |
RED |
2 |
1 |
1 |
0 |
0.500
|
Back to Top
Saves per Game
|
Players |
Team |
GP |
SV |
SV/GP |
| 1. |
Wes Deacon G |
BLUE |
2
|
61
|
30.50
|
| 2. |
Ripley Crosley G |
WHITE |
1
|
30
|
30.00
|
| 3. |
Colin McCloskey G |
RED |
2
|
47
|
23.50
|
| 4. |
Greg Geldart G Su |
WHITE |
1
|
23
|
23.00
|
| 5. |
Dave Kresnye G |
GREEN |
1
|
22
|
22.00
|
| 6. |
Yi Yang Goalie |
YELLOW |
2
|
44
|
22.00
|
| 7. |
Grant Passell G |
BLACK |
1
|
22
|
22.00
|
Back to Top
Save Percentage
|
Players |
Team |
GP |
SV |
Shots |
SV% |
| 1. |
Ripley Crosley G |
WHITE |
1
|
30
|
32
|
0.938
|
| 2. |
Wes Deacon G |
BLUE |
2
|
61
|
67
|
0.910
|
| 3. |
Grant Passell G |
BLACK |
1
|
22
|
26
|
0.846
|
| 4. |
Yi Yang Goalie |
YELLOW |
2
|
44
|
52
|
0.846
|
| 5. |
Dave Kresnye G |
GREEN |
1
|
22
|
27
|
0.815
|
| 6. |
Colin McCloskey G |
RED |
2
|
47
|
59
|
0.797
|
| 7. |
Greg Geldart G Su |
WHITE |
1
|
23
|
29
|
0.793
|
Back to Top
League Player of the Week
|
Player: Payton Fogarty
Team: YELLOW |
|
Categories |
Statistics |
| 1. |
Games Played |
2 |
| 2. |
Goals Scored |
8 |
| 3. |
Assists |
3 |
| 4. |
Penalty Minutes |
2 |
| 5. |
Shots on Goal |
17 |
| 6. |
Hat Tricks |
2 |
| 7. |
Playmakers |
0 |
| 8. |
Shutouts |
0 |
| 9. |
Wins |
0 |
| 10. |
Ties |
0 |
| 11. |
Saves |
0 |
| 12. |
Save Percentage |
0.000
|
THIS WEEK'S PLAYER OF THE WEEK NUMBER IS 56 .
Back to Top
Game Results For The Season
| BLUE |
| | DATE | Opponent |
Score |
H/A |
W/L |
| 1. |
5/31
|
BLACK
|
4
- 3
|
Home | W |
| 2. |
6/ 3
|
WHITE
|
2
- 3
|
Away
|
L |
| BLACK |
| | DATE | Opponent |
Score |
H/A |
W/L |
| 1. |
5/31
|
BLUE
|
3
- 4
|
Away
|
L |
| GREEN |
| | DATE | Opponent |
Score |
H/A |
W/L |
| 1. |
5/31
|
RED
|
4
- 5
|
Home | L |
| WHITE |
| | DATE | Opponent |
Score |
H/A |
W/L |
| 1. |
6/ 3
|
BLUE
|
3
- 2
|
Home | W |
| 2. |
6/ 4
|
YELLOW
|
5
- 6
|
Away
|
L |
| YELLOW |
| | DATE | Opponent |
Score |
H/A |
W/L |
| 1. |
6/ 2
|
RED
|
8
- 3
|
Home | W |
| 2. |
6/ 4
|
WHITE
|
6
- 5
|
Home | W |
| RED |
| | DATE | Opponent |
Score |
H/A |
W/L |
| 1. |
5/31
|
GREEN
|
5
- 4
|
Away
|
W |
| 2. |
6/ 2
|
YELLOW
|
3
- 8
|
Away
|
L |
Back to Top
ANY CORRECTIONS CONTACT US AT 216-382-4872 or VBENANDER@bgsd.COM
|