|
|
|
CLEVELAND HEIGHTS PLAYOFFS SOFTBALL MEN'S FRIDAY PS 2025 LEAGUE
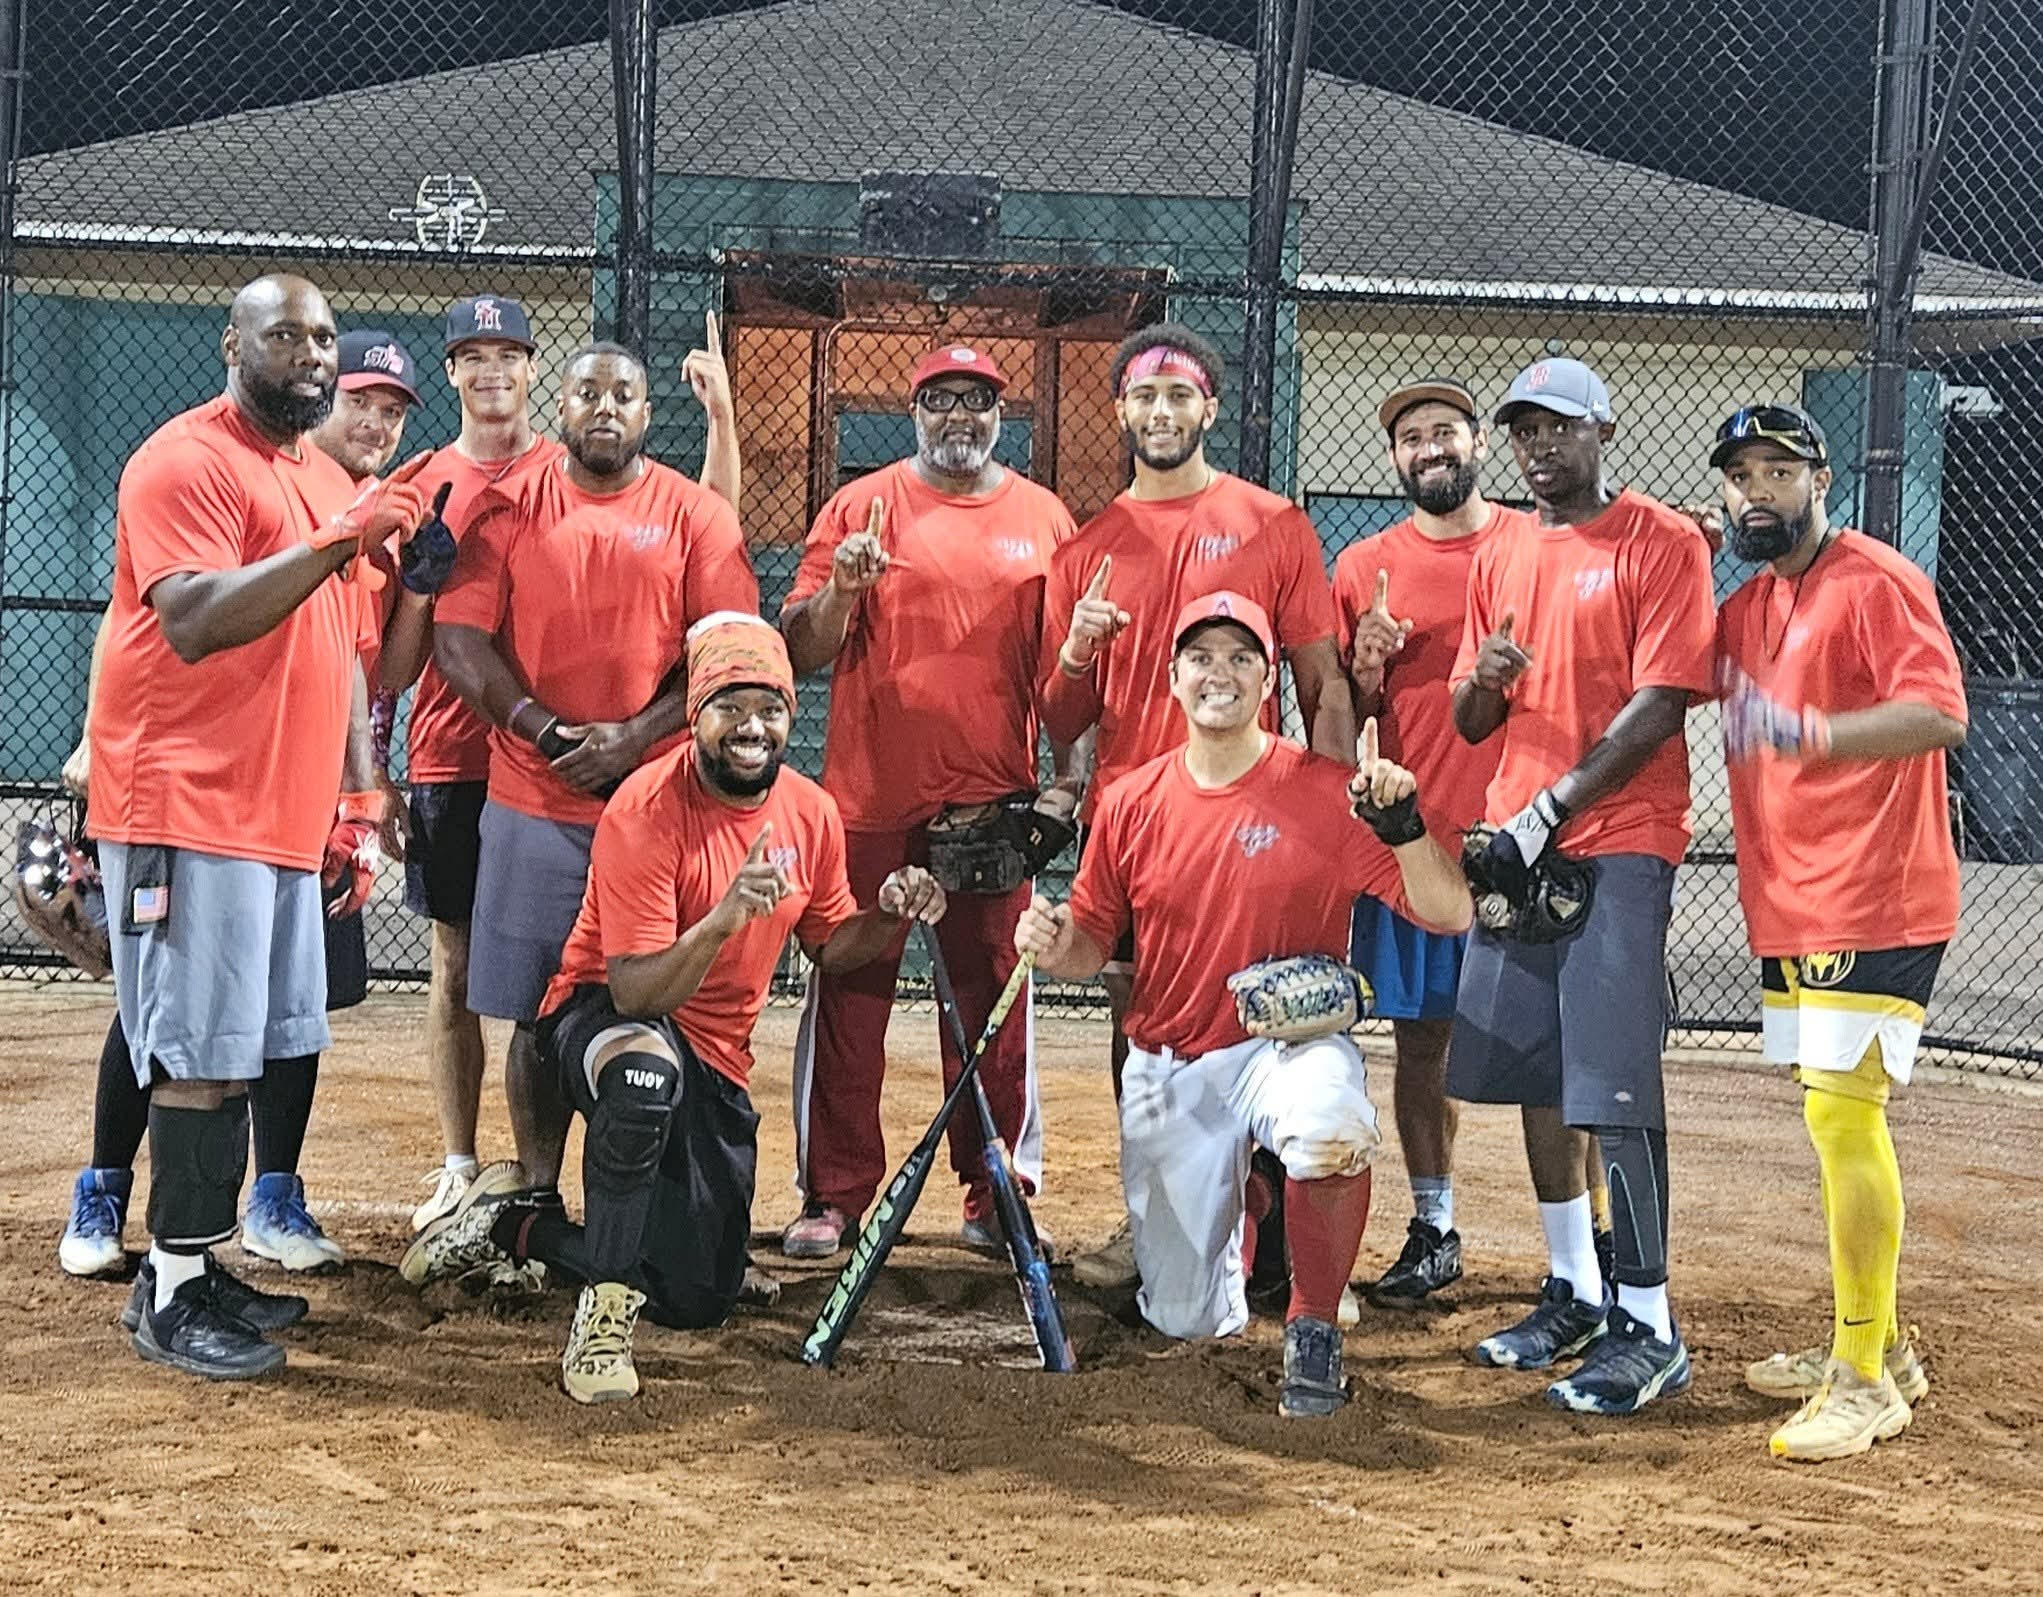
CONGRATULATIONS TO NEW HEIGHTS GRILLERZ
CLEVELAND HEIGHTS PLAYOFFS SOFTBALL MEN'S FRIDAY PS 2025 LEAGUE RUNNERS-UP! | ||||||||||||||||||||||||||||||||||||||||||||||||||||||||||||||||||||||||||||||||||||||||||||||||||||||||||||||||||||||||||||||||||||||||||||||||||||||||||||||||||||||||||||||||||||||||||||||||||||||||||||||||||||||||||||||||||||||||||||||||||||||||||||||||||||||||||||||||||||||||||||||||||||||||||||||||||||||||||||||||||||||||||||||||||||||||||||||||||||||||||||||||||||||||||||||||||||||||||||||||||||||||||||||||||||||||||||||||||||||||||||||||||||||||||||||||||||||||||||||||||||||||||||||||||||||||||||||||||||||||||||||||||||||||||||||||||||||||||||||||||||||||||||||||||||||||||||||||||||||||||||||||||||||||||||||||||||||||||||||||||||||||||||||||||||||||||||||||||||||||||||||||||||||||||||||||||||||||||||||||||||||||||||||||||||||||||||||||||||||||||||||||||||||||||||||||||||||||||||||||||||||||||||||||||||||||||||||||||||||||||||||||||||||||||||||||||||||||||||||||||||||||||||||||||||||||||||||||||||||||||||||||||||||||||||||||||||||||||||||||||||||||||||||||||||||||||||||||||||||
| Players | GP | PA | AB | H | R | RBI | D | T | HR | BB | K | SF | OBE | H/G | OPR | OB% | AVG | SLG% | OPS | HS | LHS | |
| 1 . | Randal Overby | 2 | 3 | 3 | 2 | 0 | 0 | 0 | 0 | 0 | 0 | 0 | 0 | 0 | 1.0 | 0.000 | 0.667 | 0.667 | 0.667 | 1.333 | 2 | 2 |
| 2 . | Al Frazier | 2 | 3 | 2 | 1 | 1 | 0 | 0 | 0 | 0 | 1 | 0 | 0 | 0 | 0.5 | 0.500 | 0.667 | 0.500 | 0.500 | 1.167 | 0 | 1 |
| 3 . | Greg Facing | 2 | 4 | 4 | 2 | 0 | 0 | 0 | 0 | 0 | 0 | 0 | 0 | 0 | 1.0 | 0.000 | 0.500 | 0.500 | 0.500 | 1.000 | 0 | 1 |
| 4 . | Beau Harris | 2 | 2 | 2 | 1 | 1 | 1 | 0 | 0 | 1 | 0 | 0 | 0 | 0 | 0.5 | 1.000 | 0.500 | 0.500 | 2.000 | 2.500 | 1 | 1 |
| 5 . | Chris McGray | 2 | 2 | 2 | 1 | 0 | 0 | 0 | 0 | 0 | 0 | 0 | 0 | 0 | 0.5 | 0.000 | 0.500 | 0.500 | 0.500 | 1.000 | 0 | 1 |
| 6 . | Donald Overby | 2 | 3 | 3 | 1 | 0 | 0 | 0 | 0 | 0 | 0 | 0 | 0 | 0 | 0.5 | 0.000 | 0.333 | 0.333 | 0.333 | 0.667 | 0 | 1 |
| 7 . | Eric Evans | 2 | 3 | 2 | 0 | 1 | 0 | 0 | 0 | 0 | 1 | 1 | 0 | 0 | 0.0 | 0.500 | 0.333 | 0.000 | 0.000 | 0.333 | 0 | 0 |
| 8 . | Brandon Gibbs | 1 | 1 | 1 | 0 | 0 | 0 | 0 | 0 | 0 | 0 | 0 | 0 | 0 | 0.0 | 0.000 | 0.000 | 0.000 | 0.000 | 0.000 | 0 | 0 |
| 9 . | Marvin Lewis | 2 | 3 | 3 | 0 | 0 | 0 | 0 | 0 | 0 | 0 | 0 | 0 | 0 | 0.0 | 0.000 | 0.000 | 0.000 | 0.000 | 0.000 | 0 | 0 |
| 10 . | Derrick Mize | 2 | 3 | 3 | 0 | 0 | 0 | 0 | 0 | 0 | 0 | 0 | 0 | 0 | 0.0 | 0.000 | 0.000 | 0.000 | 0.000 | 0.000 | 0 | 0 |
| 11 . | Charles Conditt | 1 | 1 | 1 | 0 | 0 | 0 | 0 | 0 | 0 | 0 | 0 | 0 | 0 | 0.0 | 0.000 | 0.000 | 0.000 | 0.000 | 0.000 | 0 | 0 |
| TOTALS | 2 | 28 | 26 | 8 | 3 | 1 | 0 | 0 | 1 | 2 | 1 | 0 | 0 | 4.0 | 0.15 | 0.357 | 0.308 | 0.423 | 0.780 |
| Game 1 8/15 1-19 NEW HEIG AWAY |
Game 2 8/15 2-29 NEW HEIG HOME |
| Runs Scored | Runs Allowed |
| 1.50
runs/game |
24.00
runs/game |
| Differential | |
| -22.50
runs/game |
|
| Infield Errors | Outfield Errors |
| 0 infield errors |
0 outfield errors |
| Total Errors | Errors/Game |
| 0 total errors |
0.000 errors/game |
OPR, AVG, OBP and SLG% needs a minimum of 4 at bats.
| Categories | Players | Statistics |
| At Bats | Greg Facing | 4 |
| Total Hits | Randal Overby , Greg Facing | 2 |
| Home Runs | Beau Harris | 1 |
| Runs Scored | Al Frazier , Eric Evans , Beau Harris | 1 |
| Runs Batted In | Beau Harris | 1 |
| Offensive Potency Ratio | Beau Harris | ***** |
| Batting Average | Greg Facing | 0.500 |
| Doubles | NO ONE HAS ANY | 0 |
| Triples | NO ONE HAS ANY | 0 |
| Walks | Al Frazier , Eric Evans | 1 |
| On Base By Error | NO ONE HAS ANY | 0 |
| On Base Percentage | Greg Facing | 0.500 |
| Slugging Percentage | Greg Facing | 0.500 |
| Present Hitting Streak | Randal Overby | 2 |
| Longest Hitting Streak | Randal Overby | 2 |
| Sacrifice Flies | NO ONE HAS ANY | 0 |
NO ONE QUALIFIEDGP= 0 AB= 0 H= 0 R= 0 RBI= 0 D= 0 T= 0 HR= 0 W= 0 SF= 0 OBBE= 0 OPR= 0 AVE= 0 SL%= 0
| Players | GP | PA | AB | H | R | RBI | D | T | HR | BB | K | SF | OBE | H/G | OPR | OB% | AVG | SLG% | OPS | HS | LHS | |
| 1 . | Marquis Marshall | 2 | 5 | 4 | 3 | 2 | 3 | 0 | 0 | 0 | 1 | 0 | 0 | 0 | 1.5 | 1.250 | 0.800 | 0.750 | 0.750 | 1.550 | 2 | 2 |
| 2 . | Ronnie Vinson | 2 | 8 | 6 | 3 | 2 | 0 | 0 | 0 | 0 | 2 | 0 | 0 | 0 | 1.5 | 0.333 | 0.625 | 0.500 | 0.500 | 1.125 | 2 | 2 |
| 3 . | Charles Little | 1 | 4 | 2 | 1 | 1 | 0 | 0 | 0 | 0 | 2 | 1 | 0 | 0 | 1.0 | 0.500 | 0.750 | 0.500 | 0.500 | 1.250 | 1 | 1 |
| 4 . | Travon Smith | 2 | 8 | 7 | 3 | 1 | 0 | 0 | 0 | 0 | 1 | 0 | 0 | 1 | 1.5 | 0.143 | 0.625 | 0.429 | 0.429 | 1.054 | 2 | 2 |
| 5 . | James Douglas | 2 | 8 | 7 | 3 | 2 | 4 | 0 | 0 | 0 | 1 | 0 | 0 | 0 | 1.5 | 0.857 | 0.500 | 0.429 | 0.429 | 0.929 | 2 | 2 |
| 6 . | Tajuan Moerer | 2 | 8 | 7 | 3 | 1 | 0 | 0 | 0 | 0 | 1 | 0 | 0 | 0 | 1.5 | 0.143 | 0.500 | 0.429 | 0.429 | 0.929 | 2 | 2 |
| 7 . | Archie Patrick | 2 | 8 | 8 | 3 | 0 | 1 | 1 | 0 | 0 | 0 | 0 | 0 | 0 | 1.5 | 0.125 | 0.375 | 0.375 | 0.500 | 0.875 | 2 | 2 |
| 8 . | Mike Phipps | 1 | 3 | 3 | 1 | 1 | 0 | 0 | 0 | 0 | 0 | 0 | 0 | 0 | 1.0 | 0.333 | 0.333 | 0.333 | 0.333 | 0.667 | 1 | 1 |
| 9 . | Montell Goodwin | 2 | 8 | 7 | 2 | 1 | 3 | 1 | 1 | 0 | 1 | 0 | 0 | 0 | 1.0 | 0.571 | 0.375 | 0.286 | 0.714 | 1.089 | 0 | 1 |
| 10 . | Pat Laster | 2 | 8 | 4 | 1 | 2 | 3 | 1 | 0 | 0 | 3 | 0 | 1 | 0 | 0.5 | 1.250 | 0.571 | 0.250 | 0.500 | 1.071 | 1 | 1 |
| 11 . | Aaron Hunter | 2 | 9 | 8 | 1 | 0 | 1 | 0 | 0 | 0 | 0 | 0 | 1 | 0 | 0.5 | 0.125 | 0.125 | 0.125 | 0.125 | 0.250 | 1 | 1 |
| TOTALS | 2 | 77 | 63 | 24 | 13 | 15 | 3 | 1 | 0 | 12 | 1 | 2 | 1 | 12.0 | 0.44 | 0.493 | 0.381 | 0.460 | 0.954 |
| Game 1 8/15 6-15 CRUSADER AWAY |
Game 2 8/15 7-25 CRUSADER HOME |
| Runs Scored | Runs Allowed |
| 6.50
runs/game |
20.00
runs/game |
| Differential | |
| -13.50
runs/game |
|
| Infield Errors | Outfield Errors |
| 0 infield errors |
0 outfield errors |
| Total Errors | Errors/Game |
| 0 total errors |
0.000 errors/game |
OPR, AVG, OBP and SLG% needs a minimum of 4 at bats.
| Categories | Players | Statistics |
| At Bats | Aaron Hunter , Archie Patrick | 8 |
| Total Hits | 6 players are tied with | 3 |
| Home Runs | NO ONE HAS ANY | 0 |
| Runs Scored | 4 players are tied with | 2 |
| Runs Batted In | James Douglas | 4 |
| Offensive Potency Ratio | Pat Laster , Marquis Marshall | 1.250 |
| Batting Average | Marquis Marshall | 0.750 |
| Doubles | Montell Goodwin , Pat Laster , Archie Patrick | 1 |
| Triples | Montell Goodwin | 1 |
| Walks | Pat Laster | 3 |
| On Base By Error | Travon Smith | 1 |
| On Base Percentage | Marquis Marshall | 0.800 |
| Slugging Percentage | Marquis Marshall | 0.750 |
| Present Hitting Streak | 6 players are tied with | 2 |
| Longest Hitting Streak | 6 players are tied with | 2 |
| Sacrifice Flies | Aaron Hunter , Pat Laster | 1 |
SORRY, NO ONE QUALIFIEDGP= 0 AB= 0 H= 0 R= 0 RBI= 0 D= 0 T= 0 HR= 0 W= 0 SF= 0 OBBE= 0 OPR= 0 AVE= 0 SL%= 0
| Players | GP | PA | AB | H | R | RBI | D | T | HR | BB | K | SF | OBE | H/G | OPR | OB% | AVG | SLG% | OPS | HS | LHS | |
| 1 . | Steve Lang | 2 | 10 | 9 | 6 | 6 | 2 | 0 | 1 | 0 | 1 | 0 | 0 | 0 | 3.0 | 0.889 | 0.700 | 0.667 | 0.889 | 1.589 | 2 | 2 |
| 2 . | Owen Lang | 4 | 15 | 12 | 8 | 9 | 6 | 1 | 0 | 3 | 2 | 0 | 1 | 1 | 2.0 | 1.250 | 0.786 | 0.667 | 1.500 | 2.286 | 1 | 2 |
| 3 . | Vince Holland | 4 | 15 | 14 | 9 | 7 | 2 | 3 | 1 | 0 | 1 | 0 | 0 | 0 | 2.3 | 0.643 | 0.667 | 0.643 | 1.000 | 1.667 | 4 | 4 |
| 4 . | Robert Edwards | 4 | 15 | 14 | 9 | 4 | 8 | 1 | 0 | 0 | 1 | 0 | 0 | 0 | 2.3 | 0.857 | 0.667 | 0.643 | 0.714 | 1.381 | 4 | 4 |
| 5 . | Ned Trivisonno | 4 | 15 | 12 | 6 | 4 | 9 | 2 | 1 | 0 | 1 | 2 | 2 | 0 | 1.5 | 1.083 | 0.538 | 0.500 | 0.833 | 1.372 | 1 | 2 |
| 6 . | Gabriel Dabrey | 4 | 15 | 15 | 7 | 3 | 2 | 0 | 0 | 0 | 0 | 2 | 0 | 0 | 1.8 | 0.333 | 0.467 | 0.467 | 0.467 | 0.933 | 4 | 4 |
| 7 . | Noah Weisblat | 4 | 15 | 14 | 6 | 5 | 4 | 1 | 0 | 0 | 1 | 0 | 0 | 0 | 1.5 | 0.643 | 0.467 | 0.429 | 0.500 | 0.967 | 0 | 3 |
| 8 . | Anthony Elfan | 4 | 14 | 14 | 6 | 3 | 3 | 0 | 1 | 0 | 0 | 1 | 0 | 0 | 1.5 | 0.429 | 0.429 | 0.429 | 0.571 | 1.000 | 0 | 3 |
| 9 . | Jay Calloway | 2 | 5 | 5 | 2 | 0 | 0 | 0 | 0 | 0 | 0 | 0 | 0 | 0 | 1.0 | 0.000 | 0.400 | 0.400 | 0.400 | 0.800 | 2 | 2 |
| 10 . | Eli Weisblat | 4 | 15 | 14 | 5 | 5 | 1 | 1 | 0 | 0 | 1 | 0 | 0 | 0 | 1.3 | 0.429 | 0.400 | 0.357 | 0.429 | 0.829 | 0 | 3 |
| 11 . | Joey Houser | 4 | 12 | 12 | 3 | 1 | 2 | 1 | 0 | 0 | 0 | 1 | 0 | 0 | 0.8 | 0.250 | 0.250 | 0.250 | 0.333 | 0.583 | 1 | 2 |
| 12 . | Kenny Dandrige | 4 | 15 | 15 | 3 | 2 | 4 | 0 | 2 | 0 | 0 | 2 | 0 | 0 | 0.8 | 0.400 | 0.200 | 0.200 | 0.467 | 0.667 | 1 | 1 |
| TOTALS | 4 | 161 | 150 | 70 | 49 | 43 | 10 | 6 | 3 | 8 | 8 | 3 | 1 | 17.5 | 0.61 | 0.500 | 0.467 | 0.673 | 1.173 |
| Game 1 8/15 15- 6 BAD NEWS HOME |
Game 2 8/15 25- 7 BAD NEWS AWAY |
Game 3 8/22 5-17 NEW HEIG AWAY |
Game 4 8/22 4-18 NEW HEIG HOME |
| Runs Scored | Runs Allowed |
| 12.25
runs/game |
12.00
runs/game |
| Differential | |
| +0.25
runs/game |
|
| Infield Errors | Outfield Errors |
| 0 infield errors |
0 outfield errors |
| Total Errors | Errors/Game |
| 0 total errors |
0.000 errors/game |
OPR, AVG, OBP and SLG% needs a minimum of 8 at bats.
| Categories | Players | Statistics |
| At Bats | Gabriel Dabrey , Kenny Dandrige | 15 |
| Total Hits | Robert Edwards , Vince Holland | 9 |
| Home Runs | Owen Lang | 3 |
| Runs Scored | Owen Lang | 9 |
| Runs Batted In | Ned Trivisonno | 9 |
| Offensive Potency Ratio | Owen Lang | 1.250 |
| Batting Average | Steve Lang , Owen Lang | 0.667 |
| Doubles | Vince Holland | 3 |
| Triples | Kenny Dandrige | 2 |
| Walks | Owen Lang | 2 |
| On Base By Error | Owen Lang | 1 |
| On Base Percentage | Owen Lang | 0.786 |
| Slugging Percentage | Owen Lang | 1.500 |
| Present Hitting Streak | Gabriel Dabrey , Robert Edwards , Vince Holland | 4 |
| Longest Hitting Streak | Gabriel Dabrey , Robert Edwards , Vince Holland | 4 |
| Sacrifice Flies | Ned Trivisonno | 2 |
Vince Holland GP= 2 AB= 6 H= 5 R= 3 RBI= 0 D= 1 T= 1 HR= 0 W= 0 SF= 0 OBBE= 0 OPR= .5 AVE= .833 SL%= 1.333
| Players | GP | PA | AB | H | R | RBI | D | T | HR | BB | K | SF | OBE | H/G | OPR | OB% | AVG | SLG% | OPS | HS | LHS | |
| 1 . | Reggie Brown | 4 | 15 | 11 | 10 | 10 | 8 | 2 | 1 | 2 | 4 | 0 | 0 | 0 | 2.5 | 1.636 | 0.933 | 0.909 | 1.818 | 2.752 | 4 | 4 |
| 2 . | Darvel Harris | 2 | 7 | 7 | 6 | 3 | 6 | 1 | 3 | 0 | 0 | 0 | 0 | 0 | 3.0 | 1.286 | 0.857 | 0.857 | 1.857 | 2.714 | 2 | 2 |
| 3 . | Brian Benander | 4 | 16 | 15 | 12 | 9 | 7 | 3 | 4 | 1 | 1 | 0 | 0 | 1 | 3.0 | 1.067 | 0.875 | 0.800 | 1.733 | 2.608 | 4 | 4 |
| 4 . | Matt Gundling | 4 | 15 | 15 | 11 | 8 | 11 | 1 | 1 | 1 | 0 | 0 | 0 | 0 | 2.8 | 1.267 | 0.733 | 0.733 | 1.133 | 1.867 | 4 | 4 |
| 5 . | Anthony Morris | 2 | 7 | 7 | 5 | 2 | 4 | 3 | 0 | 0 | 0 | 0 | 0 | 0 | 2.5 | 0.857 | 0.714 | 0.714 | 1.143 | 1.857 | 2 | 2 |
| 6 . | Rashodd Stevens | 4 | 15 | 13 | 9 | 8 | 6 | 1 | 0 | 0 | 2 | 0 | 0 | 0 | 2.3 | 1.077 | 0.733 | 0.692 | 0.769 | 1.503 | 4 | 4 |
| 7 . | Anthony Beckam | 4 | 15 | 15 | 10 | 12 | 11 | 1 | 0 | 2 | 0 | 0 | 0 | 1 | 2.5 | 1.533 | 0.733 | 0.667 | 1.133 | 1.867 | 4 | 4 |
| 8 . | Ken McDaniels | 2 | 5 | 5 | 3 | 4 | 3 | 1 | 0 | 0 | 0 | 0 | 0 | 1 | 1.5 | 1.400 | 0.800 | 0.600 | 0.800 | 1.600 | 1 | 1 |
| 9 . | Aqeel Seals | 4 | 17 | 14 | 8 | 9 | 11 | 1 | 2 | 0 | 0 | 0 | 3 | 1 | 2.0 | 1.429 | 0.643 | 0.571 | 0.929 | 1.571 | 4 | 4 |
| 10 . | Jon Johnson | 4 | 16 | 14 | 8 | 8 | 4 | 1 | 0 | 1 | 2 | 0 | 0 | 1 | 2.0 | 0.857 | 0.688 | 0.571 | 0.857 | 1.545 | 1 | 2 |
| 11 . | Jeff Brown | 4 | 13 | 13 | 7 | 5 | 5 | 1 | 0 | 0 | 0 | 0 | 0 | 0 | 1.8 | 0.769 | 0.538 | 0.538 | 0.615 | 1.154 | 4 | 4 |
| 12 . | Mario Bynum | 2 | 6 | 6 | 3 | 3 | 1 | 1 | 0 | 0 | 0 | 0 | 0 | 0 | 1.5 | 0.667 | 0.500 | 0.500 | 0.667 | 1.167 | 2 | 2 |
| 13 . | Wes Call | 2 | 7 | 6 | 3 | 2 | 0 | 0 | 0 | 0 | 1 | 0 | 0 | 0 | 1.5 | 0.333 | 0.571 | 0.500 | 0.500 | 1.071 | 2 | 2 |
| 14 . | Bryant Thomas | 2 | 7 | 7 | 0 | 0 | 0 | 0 | 0 | 0 | 0 | 0 | 0 | 0 | 0.0 | 0.000 | 0.000 | 0.000 | 0.000 | 0.000 | 0 | 0 |
| TOTALS | 4 | 161 | 148 | 95 | 83 | 77 | 17 | 11 | 7 | 10 | 0 | 3 | 5 | 23.8 | 1.08 | 0.696 | 0.642 | 1.047 | 1.743 |
| Game 1 8/15 19- 1 ALL IN HOME |
Game 2 8/15 29- 2 ALL IN AWAY |
Game 3 8/22 17- 5 CRUSADER HOME |
Game 4 8/22 18- 4 CRUSADER AWAY |
| Runs Scored | Runs Allowed |
| 20.75
runs/game |
3.00
runs/game |
| Differential | |
| +17.75
runs/game |
|
| Infield Errors | Outfield Errors |
| 0 infield errors |
0 outfield errors |
| Total Errors | Errors/Game |
| 0 total errors |
0.000 errors/game |
OPR, AVG, OBP and SLG% needs a minimum of 8 at bats.
| Categories | Players | Statistics |
| At Bats | Anthony Beckam , Brian Benander , Matt Gundling | 15 |
| Total Hits | Brian Benander | 12 |
| Home Runs | Anthony Beckam , Reggie Brown | 2 |
| Runs Scored | Anthony Beckam | 12 |
| Runs Batted In | Anthony Beckam , Aqeel Seals , Matt Gundling | 11 |
| Offensive Potency Ratio | Reggie Brown | 1.636 |
| Batting Average | Reggie Brown | 0.909 |
| Doubles | Brian Benander , Anthony Morris | 3 |
| Triples | Brian Benander | 4 |
| Walks | Reggie Brown | 4 |
| On Base By Error | 5 players are tied with | 1 |
| On Base Percentage | Reggie Brown | 0.933 |
| Slugging Percentage | Reggie Brown | 1.818 |
| Present Hitting Streak | 7 players are tied with | 4 |
| Longest Hitting Streak | 7 players are tied with | 4 |
| Sacrifice Flies | Aqeel Seals | 3 |
Anthony Beckam GP= 2 AB= 8 H= 7 R= 7 RBI= 7 D= 1 T= 0 HR= 2 W= 0 SF= 0 OBBE= 0 OPR= 1.75 AVE= .875 SL%= 1.75
| Teams | GP | W | L | T | R/G | RA/G | RD/G | PCT | LWS | PS | GB |
| 1. NEW HEIGHTS GRILLERZ | 4 | 4 | 0 | 0 | 20.8 | 3.0 | +17.8 | 1.000 | 4 | 4W | 0.0 |
| 2. CRUSADERS | 4 | 2 | 2 | 0 | 12.3 | 12.0 | +0.3 | 0.500 | 2 | 2L | 2.0 |
| 3. ALL IN | 2 | 0 | 2 | 0 | 1.5 | 24.0 | -22.5 | 0.000 | 0 | 2L | 3.0 |
| 4. BAD NEWS BEARS | 2 | 0 | 2 | 0 | 6.5 | 20.0 | -13.5 | 0.000 | 0 | 2L | 3.0 |
| Teams | AB | H | H/G | D | T | HR | BB | SF | RF | RA | OB% | SLG% | AVG |
| 1. NEW HEIGHTS GRILLERZ | 148 | 95 | 23.8 | 17 | 11 | 7 | 10 | 3 | 83 | 12 | 0.665 | 1.047 | 0.642 |
| 2. CRUSADERS | 150 | 70 | 17.5 | 10 | 6 | 3 | 8 | 3 | 49 | 48 | 0.494 | 0.673 | 0.467 |
| 3. BAD NEWS BEARS | 63 | 24 | 12.0 | 3 | 1 | 0 | 12 | 2 | 13 | 40 | 0.480 | 0.460 | 0.381 |
| 4. ALL IN | 26 | 8 | 4.0 | 0 | 0 | 1 | 2 | 0 | 3 | 48 | 0.357 | 0.423 | 0.308 |
| Teams | GP | IF E | OF E | Tot E | E/G | Home | Away | BO | ClGm | DefGem | PowSrg |
| 1. ALL IN | 2 | 0 | 0 | 0 | 0.000 | 0 - 1 - 0 | 0 - 1 - 0 | 0 - 2 | 0 - 0 - 0 | 0 | 0 |
| 2. BAD NEWS BEARS | 2 | 0 | 0 | 0 | 0.000 | 0 - 1 - 0 | 0 - 1 - 0 | 0 - 1 | 0 - 0 - 0 | 0 | 0 |
| 3. CRUSADERS | 4 | 0 | 0 | 0 | 0.000 | 1 - 1 - 0 | 1 - 1 - 0 | 1 - 2 | 0 - 0 - 0 | 0 | 1 |
| 4. NEW HEIGHTS GRILLERZ | 4 | 0 | 0 | 0 | 0.000 | 2 - 0 - 0 | 2 - 0 - 0 | 4 - 0 | 0 - 0 - 0 | 3 | 3 |
Blowouts (BO): Record in Games decided by 12 or more runs.
Close Games (ClGm): Record in Games decided by 4 or fewer runs.
Defensive Gems (DefGem): Games holding opponents to 4 or fewer runs.
Power Surge (PowSrg): Games scoring 18 or more runs.
| Players | Team | AB | H | PHS | LHS | AVG | |
| 1. | Reggie Brown | NEW HEIGHTS GRILLERZ | 11 | 10 | 4 | 4 | 0.909 |
| 2. | Darvel Harris | NEW HEIGHTS GRILLERZ | 7 | 6 | 2 | 2 | 0.857 |
| 3. | Brian Benander | NEW HEIGHTS GRILLERZ | 15 | 12 | 4 | 4 | 0.800 |
| 4. | Matt Gundling | NEW HEIGHTS GRILLERZ | 15 | 11 | 4 | 4 | 0.733 |
| 5. | Anthony Morris | NEW HEIGHTS GRILLERZ | 7 | 5 | 2 | 2 | 0.714 |
| 6. | Rashodd Stevens | NEW HEIGHTS GRILLERZ | 13 | 9 | 4 | 4 | 0.692 |
| 7. | Anthony Beckam | NEW HEIGHTS GRILLERZ | 15 | 10 | 4 | 4 | 0.667 |
| 8. | Owen Lang | CRUSADERS | 12 | 8 | 1 | 2 | 0.667 |
| 9. | Steve Lang | CRUSADERS | 9 | 6 | 2 | 2 | 0.667 |
| 10. | Vince Holland | CRUSADERS | 14 | 9 | 4 | 4 | 0.643 |
| 11. | Robert Edwards | CRUSADERS | 14 | 9 | 4 | 4 | 0.643 |
| 12. | Aqeel Seals | NEW HEIGHTS GRILLERZ | 14 | 8 | 4 | 4 | 0.571 |
| 13. | Jon Johnson | NEW HEIGHTS GRILLERZ | 14 | 8 | 1 | 2 | 0.571 |
| 14. | Jeff Brown | NEW HEIGHTS GRILLERZ | 13 | 7 | 4 | 4 | 0.538 |
| 15. | Wes Call | NEW HEIGHTS GRILLERZ | 6 | 3 | 2 | 2 | 0.500 |
| 16. | Mario Bynum | NEW HEIGHTS GRILLERZ | 6 | 3 | 2 | 2 | 0.500 |
| 17. | Ned Trivisonno | CRUSADERS | 12 | 6 | 1 | 2 | 0.500 |
| 18. | Ronnie Vinson | BAD NEWS BEARS | 6 | 3 | 2 | 2 | 0.500 |
| 19. | Gabriel Dabrey | CRUSADERS | 15 | 7 | 4 | 4 | 0.467 |
| Players | Team | AB | RUNS | RBI | OPR | |
| 1. | Reggie Brown | NEW HEIGHTS GRILLERZ | 11 | 10 | 8 | 1.636 |
| 2. | Anthony Beckam | NEW HEIGHTS GRILLERZ | 15 | 12 | 11 | 1.533 |
| 3. | Aqeel Seals | NEW HEIGHTS GRILLERZ | 14 | 9 | 11 | 1.429 |
| 4. | Darvel Harris | NEW HEIGHTS GRILLERZ | 7 | 3 | 6 | 1.286 |
| 5. | Matt Gundling | NEW HEIGHTS GRILLERZ | 15 | 8 | 11 | 1.267 |
| 6. | Owen Lang | CRUSADERS | 12 | 9 | 6 | 1.250 |
| 7. | Ned Trivisonno | CRUSADERS | 12 | 4 | 9 | 1.083 |
| 8. | Rashodd Stevens | NEW HEIGHTS GRILLERZ | 13 | 8 | 6 | 1.077 |
| 9. | Brian Benander | NEW HEIGHTS GRILLERZ | 15 | 9 | 7 | 1.067 |
| 10. | Steve Lang | CRUSADERS | 9 | 6 | 2 | 0.889 |
| 11. | Anthony Morris | NEW HEIGHTS GRILLERZ | 7 | 2 | 4 | 0.857 |
| 12. | Jon Johnson | NEW HEIGHTS GRILLERZ | 14 | 8 | 4 | 0.857 |
| 13. | Robert Edwards | CRUSADERS | 14 | 4 | 8 | 0.857 |
| 14. | James Douglas | BAD NEWS BEARS | 7 | 2 | 4 | 0.857 |
| 15. | Jeff Brown | NEW HEIGHTS GRILLERZ | 13 | 5 | 5 | 0.769 |
| 16. | Mario Bynum | NEW HEIGHTS GRILLERZ | 6 | 3 | 1 | 0.667 |
| 17. | Vince Holland | CRUSADERS | 14 | 7 | 2 | 0.643 |
| 18. | Noah Weisblat | CRUSADERS | 14 | 5 | 4 | 0.643 |
| 19. | Montell Goodwin | BAD NEWS BEARS | 7 | 1 | 3 | 0.571 |
| 20. | Anthony Elfan | CRUSADERS | 14 | 3 | 3 | 0.429 |
| 21. | Eli Weisblat | CRUSADERS | 14 | 5 | 1 | 0.429 |
| 22. | Kenny Dandrige | CRUSADERS | 15 | 2 | 4 | 0.400 |
| Players | Team | AB | HR | HR/AB | |
| 1. | Owen Lang | CRUSADERS | 12 | 3 | 0.250 |
| 2. | Reggie Brown | NEW HEIGHTS GRILLERZ | 11 | 2 | 0.182 |
| 3. | Anthony Beckam | NEW HEIGHTS GRILLERZ | 15 | 2 | 0.133 |
| 4. | Jon Johnson | NEW HEIGHTS GRILLERZ | 14 | 1 | 0.071 |
| 5. | Matt Gundling | NEW HEIGHTS GRILLERZ | 15 | 1 | 0.067 |
| 6. | Beau Harris | ALL IN | 2 | 1 | 0.500 |
| 7. | Brian Benander | NEW HEIGHTS GRILLERZ | 15 | 1 | 0.067 |
| Players | Team | AB | RBI | RBI/AB | |
| 1. | Anthony Beckam | NEW HEIGHTS GRILLERZ | 15 | 11 | 0.733 |
| 2. | Aqeel Seals | NEW HEIGHTS GRILLERZ | 14 | 11 | 0.786 |
| 3. | Matt Gundling | NEW HEIGHTS GRILLERZ | 15 | 11 | 0.733 |
| 4. | Ned Trivisonno | CRUSADERS | 12 | 9 | 0.750 |
| 5. | Reggie Brown | NEW HEIGHTS GRILLERZ | 11 | 8 | 0.727 |
| 6. | Robert Edwards | CRUSADERS | 14 | 8 | 0.571 |
| 7. | Brian Benander | NEW HEIGHTS GRILLERZ | 15 | 7 | 0.467 |
| 8. | Darvel Harris | NEW HEIGHTS GRILLERZ | 7 | 6 | 0.857 |
| 9. | Rashodd Stevens | NEW HEIGHTS GRILLERZ | 13 | 6 | 0.462 |
| 10. | Owen Lang | CRUSADERS | 12 | 6 | 0.500 |
| 11. | Jeff Brown | NEW HEIGHTS GRILLERZ | 13 | 5 | 0.385 |
| 12. | Jon Johnson | NEW HEIGHTS GRILLERZ | 14 | 4 | 0.286 |
| 13. | Anthony Morris | NEW HEIGHTS GRILLERZ | 7 | 4 | 0.571 |
| 14. | Noah Weisblat | CRUSADERS | 14 | 4 | 0.286 |
| 15. | Kenny Dandrige | CRUSADERS | 15 | 4 | 0.267 |
| 16. | James Douglas | BAD NEWS BEARS | 7 | 4 | 0.571 |
| 17. | Ken McDaniels | NEW HEIGHTS GRILLERZ | 5 | 3 | 0.600 |
| 18. | Pat Laster | BAD NEWS BEARS | 4 | 3 | 0.750 |
| 19. | Anthony Elfan | CRUSADERS | 14 | 3 | 0.214 |
| 20. | Marquis Marshall | BAD NEWS BEARS | 4 | 3 | 0.750 |
| 21. | Montell Goodwin | BAD NEWS BEARS | 7 | 3 | 0.429 |
| 22. | Joey Houser | CRUSADERS | 12 | 2 | 0.167 |
| 23. | Gabriel Dabrey | CRUSADERS | 15 | 2 | 0.133 |
| 24. | Steve Lang | CRUSADERS | 9 | 2 | 0.222 |
| 25. | Vince Holland | CRUSADERS | 14 | 2 | 0.143 |
| Players | Team | AB | RUNS | R/AB | |
| 1. | Anthony Beckam | NEW HEIGHTS GRILLERZ | 15 | 12 | 0.800 |
| 2. | Reggie Brown | NEW HEIGHTS GRILLERZ | 11 | 10 | 0.909 |
| 3. | Brian Benander | NEW HEIGHTS GRILLERZ | 15 | 9 | 0.600 |
| 4. | Aqeel Seals | NEW HEIGHTS GRILLERZ | 14 | 9 | 0.643 |
| 5. | Owen Lang | CRUSADERS | 12 | 9 | 0.750 |
| 6. | Rashodd Stevens | NEW HEIGHTS GRILLERZ | 13 | 8 | 0.615 |
| 7. | Jon Johnson | NEW HEIGHTS GRILLERZ | 14 | 8 | 0.571 |
| 8. | Matt Gundling | NEW HEIGHTS GRILLERZ | 15 | 8 | 0.533 |
| 9. | Vince Holland | CRUSADERS | 14 | 7 | 0.500 |
| 10. | Steve Lang | CRUSADERS | 9 | 6 | 0.667 |
| 11. | Jeff Brown | NEW HEIGHTS GRILLERZ | 13 | 5 | 0.385 |
| 12. | Noah Weisblat | CRUSADERS | 14 | 5 | 0.357 |
| 13. | Eli Weisblat | CRUSADERS | 14 | 5 | 0.357 |
| 14. | Ken McDaniels | NEW HEIGHTS GRILLERZ | 5 | 4 | 0.800 |
| 15. | Robert Edwards | CRUSADERS | 14 | 4 | 0.286 |
| 16. | Ned Trivisonno | CRUSADERS | 12 | 4 | 0.333 |
| 17. | Darvel Harris | NEW HEIGHTS GRILLERZ | 7 | 3 | 0.429 |
| 18. | Mario Bynum | NEW HEIGHTS GRILLERZ | 6 | 3 | 0.500 |
| 19. | Gabriel Dabrey | CRUSADERS | 15 | 3 | 0.200 |
| 20. | Anthony Elfan | CRUSADERS | 14 | 3 | 0.214 |
| Players | Team | AB | DOUBLES | DOUBLES/AB | |
| 1. | Brian Benander | NEW HEIGHTS GRILLERZ | 15 | 3 | 0.200 |
| 2. | Anthony Morris | NEW HEIGHTS GRILLERZ | 7 | 3 | 0.429 |
| 3. | Vince Holland | CRUSADERS | 14 | 3 | 0.214 |
| 4. | Reggie Brown | NEW HEIGHTS GRILLERZ | 11 | 2 | 0.182 |
| 5. | Ned Trivisonno | CRUSADERS | 12 | 2 | 0.167 |
| 6. | Darvel Harris | NEW HEIGHTS GRILLERZ | 7 | 1 | 0.143 |
| 7. | Jon Johnson | NEW HEIGHTS GRILLERZ | 14 | 1 | 0.071 |
| 8. | Anthony Beckam | NEW HEIGHTS GRILLERZ | 15 | 1 | 0.067 |
| 9. | Rashodd Stevens | NEW HEIGHTS GRILLERZ | 13 | 1 | 0.077 |
| 10. | Aqeel Seals | NEW HEIGHTS GRILLERZ | 14 | 1 | 0.071 |
| 11. | Ken McDaniels | NEW HEIGHTS GRILLERZ | 5 | 1 | 0.200 |
| 12. | Matt Gundling | NEW HEIGHTS GRILLERZ | 15 | 1 | 0.067 |
| 13. | Archie Patrick | BAD NEWS BEARS | 8 | 1 | 0.125 |
| 14. | Robert Edwards | CRUSADERS | 14 | 1 | 0.071 |
| 15. | Montell Goodwin | BAD NEWS BEARS | 7 | 1 | 0.143 |
| 16. | Joey Houser | CRUSADERS | 12 | 1 | 0.083 |
| 17. | Owen Lang | CRUSADERS | 12 | 1 | 0.083 |
| 18. | Pat Laster | BAD NEWS BEARS | 4 | 1 | 0.250 |
| 19. | Noah Weisblat | CRUSADERS | 14 | 1 | 0.071 |
| 20. | Eli Weisblat | CRUSADERS | 14 | 1 | 0.071 |
| Players | Team | AB | Triples | Triples/AB | |
| 1. | Brian Benander | NEW HEIGHTS GRILLERZ | 15 | 4 | 0.267 |
| 2. | Darvel Harris | NEW HEIGHTS GRILLERZ | 7 | 3 | 0.429 |
| 3. | Aqeel Seals | NEW HEIGHTS GRILLERZ | 14 | 2 | 0.143 |
| 4. | Kenny Dandrige | CRUSADERS | 15 | 2 | 0.133 |
| 5. | Reggie Brown | NEW HEIGHTS GRILLERZ | 11 | 1 | 0.091 |
| 6. | Matt Gundling | NEW HEIGHTS GRILLERZ | 15 | 1 | 0.067 |
| 7. | Montell Goodwin | BAD NEWS BEARS | 7 | 1 | 0.143 |
| 8. | Anthony Elfan | CRUSADERS | 14 | 1 | 0.071 |
| 9. | Vince Holland | CRUSADERS | 14 | 1 | 0.071 |
| 10. | Steve Lang | CRUSADERS | 9 | 1 | 0.111 |
| 11. | Ned Trivisonno | CRUSADERS | 12 | 1 | 0.083 |
| Players | Team | AB | H | 1B | 2B | 3B | HR | SLG% | |
| 1. | Darvel Harris | NEW HEIGHTS GRILLERZ | 7 | 6 | 2 | 1 | 3 | 0 | 1.857 |
| 2. | Reggie Brown | NEW HEIGHTS GRILLERZ | 11 | 10 | 5 | 2 | 1 | 2 | 1.818 |
| 3. | Brian Benander | NEW HEIGHTS GRILLERZ | 15 | 12 | 4 | 3 | 4 | 1 | 1.733 |
| 4. | Owen Lang | CRUSADERS | 12 | 8 | 4 | 1 | 0 | 3 | 1.500 |
| 5. | Anthony Morris | NEW HEIGHTS GRILLERZ | 7 | 5 | 2 | 3 | 0 | 0 | 1.143 |
| 6. | Matt Gundling | NEW HEIGHTS GRILLERZ | 15 | 11 | 8 | 1 | 1 | 1 | 1.133 |
| 7. | Anthony Beckam | NEW HEIGHTS GRILLERZ | 15 | 10 | 7 | 1 | 0 | 2 | 1.133 |
| 8. | Vince Holland | CRUSADERS | 14 | 9 | 5 | 3 | 1 | 0 | 1.000 |
| 9. | Aqeel Seals | NEW HEIGHTS GRILLERZ | 14 | 8 | 5 | 1 | 2 | 0 | 0.929 |
| 10. | Steve Lang | CRUSADERS | 9 | 6 | 5 | 0 | 1 | 0 | 0.889 |
| 11. | Jon Johnson | NEW HEIGHTS GRILLERZ | 14 | 8 | 6 | 1 | 0 | 1 | 0.857 |
| 12. | Ned Trivisonno | CRUSADERS | 12 | 6 | 3 | 2 | 1 | 0 | 0.833 |
| 13. | Rashodd Stevens | NEW HEIGHTS GRILLERZ | 13 | 9 | 8 | 1 | 0 | 0 | 0.769 |
| 14. | Robert Edwards | CRUSADERS | 14 | 9 | 8 | 1 | 0 | 0 | 0.714 |
| 15. | Montell Goodwin | BAD NEWS BEARS | 7 | 2 | 0 | 1 | 1 | 0 | 0.714 |
| 16. | Mario Bynum | NEW HEIGHTS GRILLERZ | 6 | 3 | 2 | 1 | 0 | 0 | 0.667 |
| 17. | Jeff Brown | NEW HEIGHTS GRILLERZ | 13 | 7 | 6 | 1 | 0 | 0 | 0.615 |
| 18. | Anthony Elfan | CRUSADERS | 14 | 6 | 5 | 0 | 1 | 0 | 0.571 |
| 19. | Wes Call | NEW HEIGHTS GRILLERZ | 6 | 3 | 3 | 0 | 0 | 0 | 0.500 |
| 20. | Ronnie Vinson | BAD NEWS BEARS | 6 | 3 | 3 | 0 | 0 | 0 | 0.500 |
| 21. | Noah Weisblat | CRUSADERS | 14 | 6 | 5 | 1 | 0 | 0 | 0.500 |
| 22. | Archie Patrick | BAD NEWS BEARS | 8 | 3 | 2 | 1 | 0 | 0 | 0.500 |
| Players | Team | AB | BB | BB/AB | |
| 1. | Reggie Brown | NEW HEIGHTS GRILLERZ | 11 | 4 | 0.364 |
| 2. | Pat Laster | BAD NEWS BEARS | 4 | 3 | 0.750 |
| 3. | Owen Lang | CRUSADERS | 12 | 2 | 0.167 |
| 4. | Jon Johnson | NEW HEIGHTS GRILLERZ | 14 | 2 | 0.143 |
| 5. | Rashodd Stevens | NEW HEIGHTS GRILLERZ | 13 | 2 | 0.154 |
| 6. | Charles Little | BAD NEWS BEARS | 2 | 2 | 1.000 |
| 7. | Ronnie Vinson | BAD NEWS BEARS | 6 | 2 | 0.333 |
| 8. | Robert Edwards | CRUSADERS | 14 | 1 | 0.071 |
| 9. | Steve Lang | CRUSADERS | 9 | 1 | 0.111 |
| 10. | Ned Trivisonno | CRUSADERS | 12 | 1 | 0.083 |
| Players | Team | AB | SAC. FLIES | SF/AB | |
| 1. | Aqeel Seals | NEW HEIGHTS GRILLERZ | 14 | 3 | 0.214 |
| 2. | Ned Trivisonno | CRUSADERS | 12 | 2 | 0.167 |
| 3. | Aaron Hunter | BAD NEWS BEARS | 8 | 1 | 0.125 |
| 4. | Pat Laster | BAD NEWS BEARS | 4 | 1 | 0.250 |
| 5. | Owen Lang | CRUSADERS | 12 | 1 | 0.083 |
| Players | Team | AB | OBE | OBE/AB | |
| 1. | Jon Johnson | NEW HEIGHTS GRILLERZ | 14 | 1 | 0.071 |
| 2. | Aqeel Seals | NEW HEIGHTS GRILLERZ | 14 | 1 | 0.071 |
| 3. | Ken McDaniels | NEW HEIGHTS GRILLERZ | 5 | 1 | 0.200 |
| 4. | Travon Smith | BAD NEWS BEARS | 7 | 1 | 0.143 |
| 5. | Owen Lang | CRUSADERS | 12 | 1 | 0.083 |
| 6. | Anthony Beckam | NEW HEIGHTS GRILLERZ | 15 | 1 | 0.067 |
| 7. | Brian Benander | NEW HEIGHTS GRILLERZ | 15 | 1 | 0.067 |
|
Player: Anthony Beckam Team: NEW HEIGHTS GRILLERZ |

| Categories | Statistics | |
| 1. | Games Played | 2 |
| 2. | At Bats | 8 |
| 3. | Hits | 7 |
| 4. | Runs Scored | 7 |
| 5. | Runs Batted In | 7 |
| 6. | Singles | 4 |
| 7. | Doubles | 1 |
| 8. | Triples | 0 |
| 9. | Home Runs | 2 |
| 10. | Walks | 0 |
| 11. | Sacrifice Flies | 0 |
| 12. | On Base by Error | 0 |
| 13. | On Base Percentage | 0.875 |
| 14. | Offensive Potency Ratio | 1.750 |
| 15. | Slugging Percentage | 1.750 |
| 16. | Batting Average | 0.875 |
THIS WEEK'S PLAYER OF THE WEEK NUMBER IS 353 . SEE WHO QUALIFIED FOR THIS WEEK'S POWER PLAYERS!