|
|
|
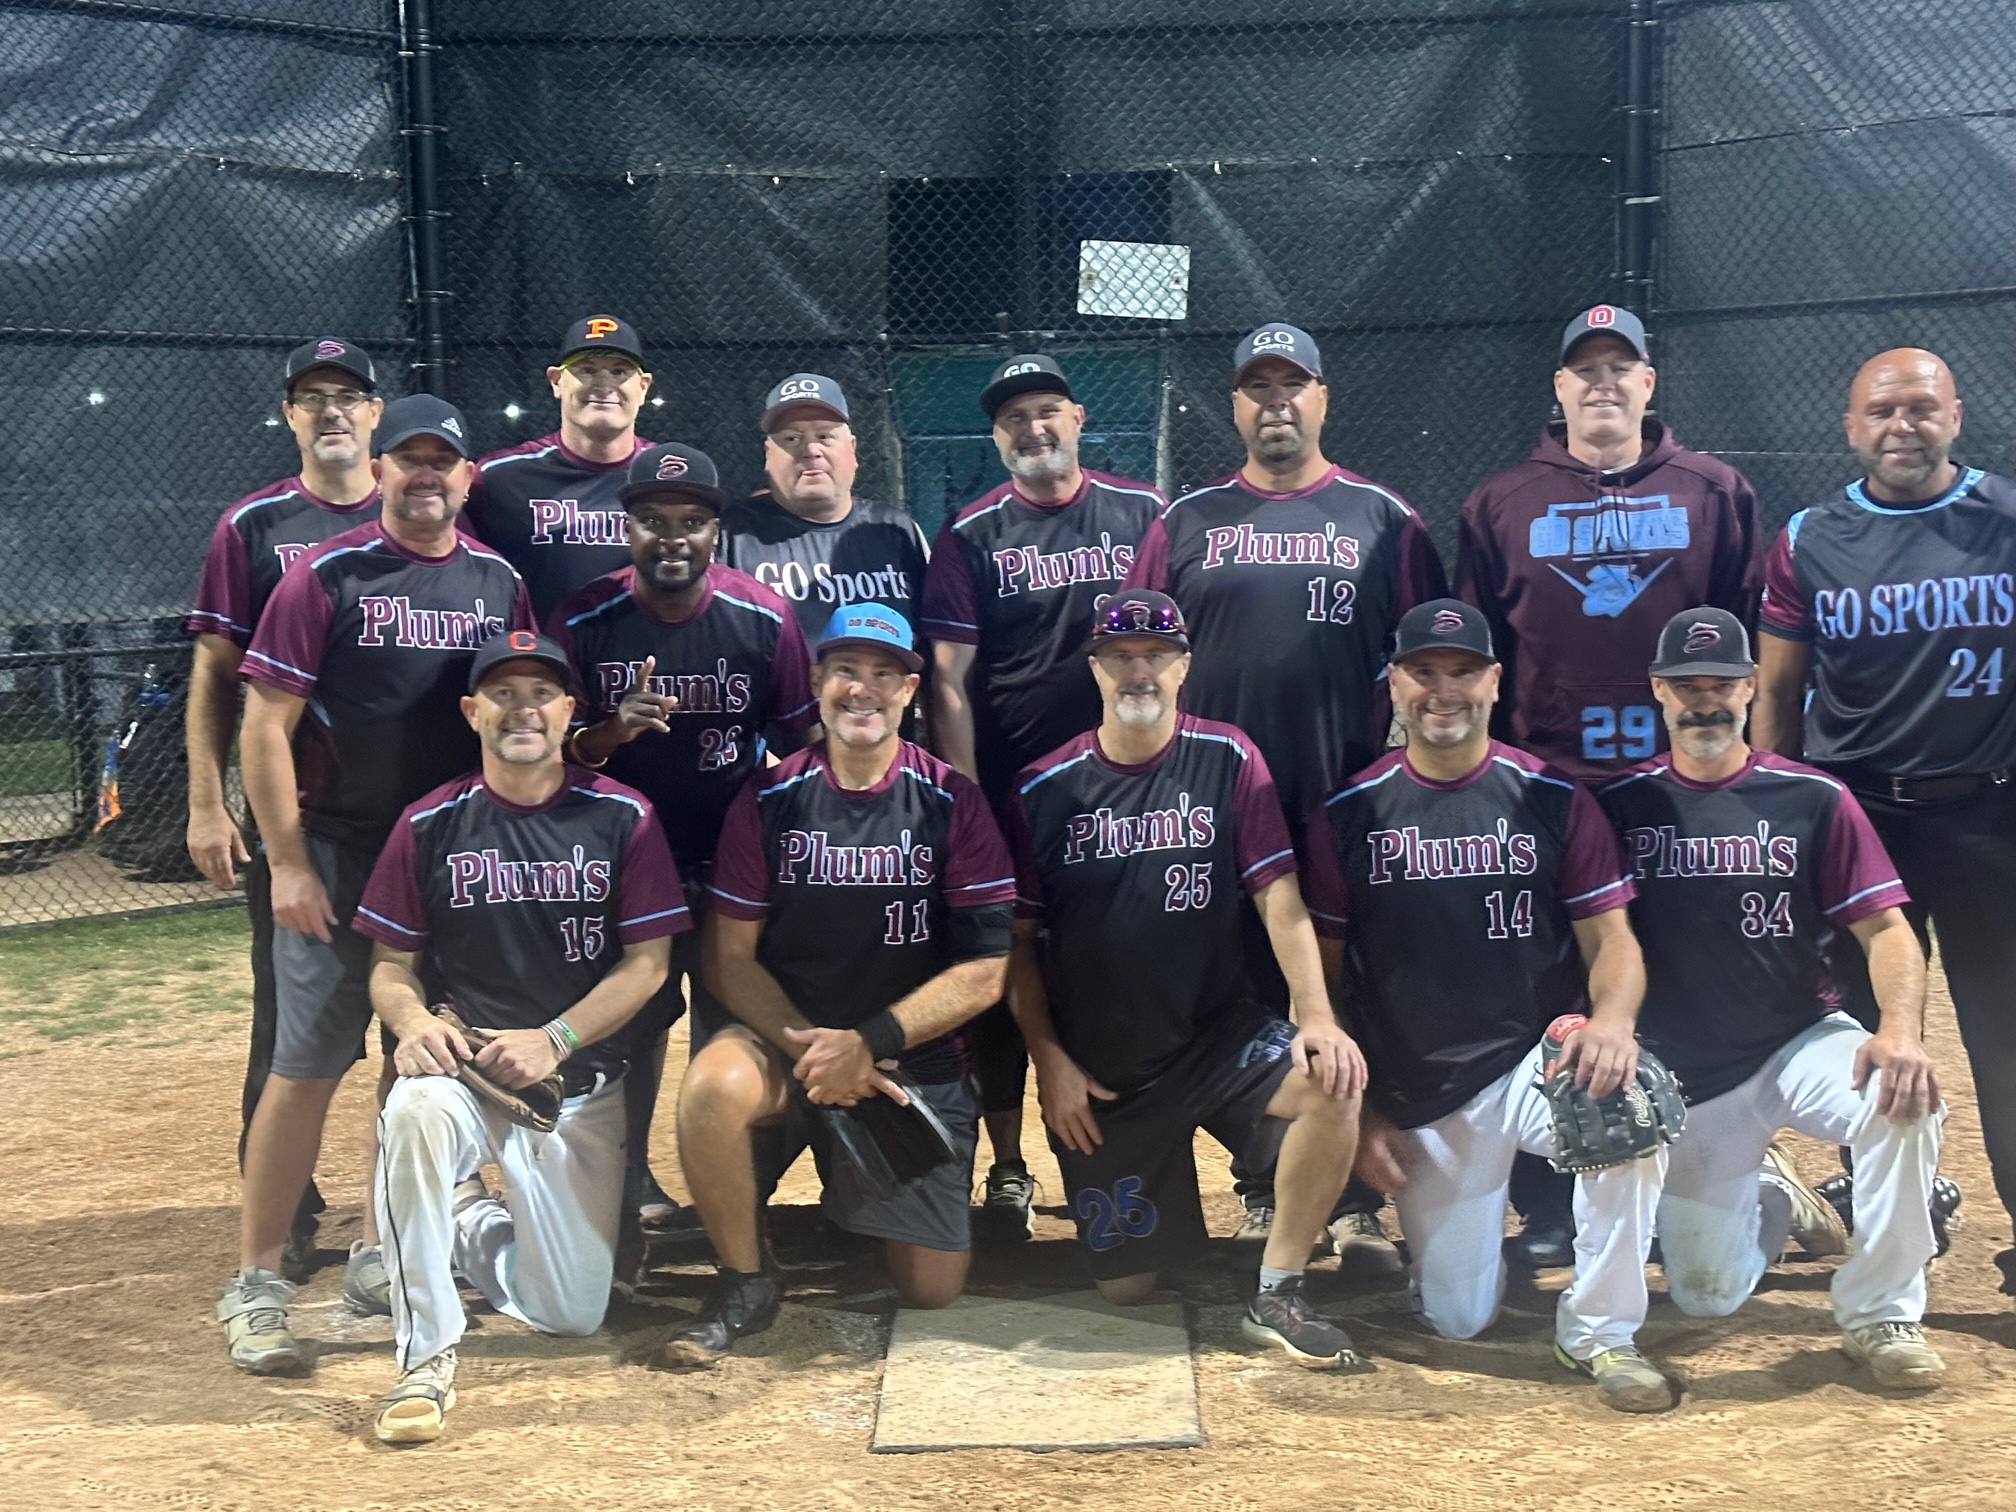
MAYFIELD VILLAGE POST SEASON SOFTBALL MEN'S 50+ PS DIV 1 2025 LEAGUE
CONGRATULATIONS TO PLUM PALS
MAYFIELD VILLAGE POST SEASON SOFTBALL MEN'S 50+ PS DIV 1 2025 LEAGUE RUNNERS-UP! | ||||||||||||||||||||||||||||||||||||||||||||||||||||||||||||||||||||||||||||||||||||||||||||||||||||||||||||||||||||||||||||||||||||||||||||||||||||||||||||||||||||||||||||||||||||||||||||||||||||||||||||||||||||||||||||||||||||||||||||||||||||||||||||||||||||||||||||||||||||||||||||||||||||||||||||||||||||||||||||||||||||||||||||||||||||||||||||||||||||||||||||||||||||||||||||||||||||||||||||||||||||||||||||||||||||||||||||||||||||||||||||||||||||||||||||||||||||||||||||||||||||||||||||||||||||||||||||||||||||||||||||||||||||||||||||||||||||||||||||||||||||||||||||||||||||||||||||||||||||||||||||||||||||||||||||||||||||||||||||||||||||||||||||||||||||||||||||||||||||||||||||||||||||||||||||||||||||||||||||||||||||||||||||||||||||||||||||||||||||||||||||||||||||||||||||||||||||||||||||||||||||||||||||||||||||||||||||||||||||||||||||||||||||||||||||||||||||||||||||||||||||||||||||||||||||||||||||||||||||||||||||||||||||||||||||||||||||||||||||||||||||||||||||||||||||||||||||||||||||||
| Players | GP | PA | AB | H | R | RBI | D | T | HR | BB | K | SF | OBE | H/G | OPR | OB% | AVG | SLG% | OPS | HS | LHS | |
| 1 . | Tony Taylor | 4 | 13 | 13 | 13 | 9 | 10 | 6 | 0 | 1 | 0 | 0 | 0 | 0 | 3.3 | 1.462 | 1.000 | 1.000 | 1.692 | 2.692 | 4 | 4 |
| 2 . | Rob Rader | 4 | 15 | 15 | 14 | 13 | 7 | 4 | 0 | 0 | 0 | 0 | 0 | 0 | 3.5 | 1.333 | 0.933 | 0.933 | 1.200 | 2.133 | 4 | 4 |
| 3 . | Joe Bachic | 4 | 14 | 13 | 12 | 11 | 16 | 1 | 0 | 4 | 1 | 1 | 0 | 0 | 3.0 | 2.077 | 0.929 | 0.923 | 1.923 | 2.852 | 4 | 4 |
| 4 . | Rick Cassidy | 4 | 13 | 11 | 9 | 9 | 9 | 2 | 0 | 0 | 2 | 0 | 0 | 0 | 2.3 | 1.636 | 0.846 | 0.818 | 1.000 | 1.846 | 4 | 4 |
| 5 . | X. Mario | 2 | 7 | 5 | 4 | 3 | 3 | 0 | 0 | 0 | 2 | 0 | 0 | 0 | 2.0 | 1.200 | 0.857 | 0.800 | 0.800 | 1.657 | 2 | 2 |
| 6 . | Bobby Woodry | 2 | 6 | 4 | 3 | 3 | 3 | 0 | 1 | 0 | 2 | 0 | 0 | 0 | 1.5 | 1.500 | 0.833 | 0.750 | 1.250 | 2.083 | 2 | 2 |
| 7 . | Sean Absten | 4 | 14 | 12 | 8 | 4 | 11 | 2 | 2 | 0 | 2 | 0 | 0 | 0 | 2.0 | 1.250 | 0.714 | 0.667 | 1.167 | 1.881 | 4 | 4 |
| 8 . | Mike Plum | 4 | 11 | 10 | 6 | 5 | 3 | 0 | 0 | 0 | 0 | 0 | 1 | 1 | 1.5 | 0.800 | 0.700 | 0.600 | 0.600 | 1.300 | 4 | 4 |
| 9 . | Matt Damsa | 4 | 11 | 10 | 6 | 6 | 3 | 1 | 1 | 0 | 1 | 1 | 0 | 0 | 1.5 | 0.900 | 0.636 | 0.600 | 0.900 | 1.536 | 0 | 3 |
| 10 . | Chris Pastiva | 4 | 15 | 12 | 7 | 9 | 2 | 3 | 0 | 0 | 2 | 0 | 1 | 1 | 1.8 | 0.917 | 0.714 | 0.583 | 0.833 | 1.548 | 4 | 4 |
| 11 . | Rick Zatta | 4 | 14 | 13 | 7 | 8 | 5 | 3 | 1 | 1 | 1 | 0 | 0 | 1 | 1.8 | 1.000 | 0.643 | 0.538 | 1.154 | 1.797 | 4 | 4 |
| 12 . | Frank Shrieves | 4 | 13 | 11 | 5 | 2 | 3 | 3 | 0 | 0 | 1 | 0 | 1 | 0 | 1.3 | 0.455 | 0.500 | 0.455 | 0.727 | 1.227 | 2 | 2 |
| 13 . | Dan Woodson | 2 | 5 | 5 | 2 | 2 | 1 | 2 | 0 | 0 | 0 | 0 | 0 | 0 | 1.0 | 0.600 | 0.400 | 0.400 | 0.800 | 1.200 | 2 | 2 |
| TOTALS | 4 | 151 | 134 | 96 | 84 | 76 | 27 | 5 | 6 | 14 | 2 | 3 | 3 | 24.0 | 1.19 | 0.764 | 0.716 | 1.127 | 1.890 |
| Game 1 9/ 3 18- 7 TCC/KMB HOME |
Game 2 9/ 3 20-11 TCC/KMB AWAY |
Game 3 9/10 22-12 KOK SENI HOME |
Game 4 9/10 24- 6 KOK SENI AWAY |
| Runs Scored | Runs Allowed |
| 21.00
runs/game |
9.00
runs/game |
| Differential | |
| +12.00
runs/game |
|
| Infield Errors | Outfield Errors |
| 0 infield errors |
0 outfield errors |
| Total Errors | Errors/Game |
| 0 total errors |
0.000 errors/game |
OPR, AVG, OBP and SLG% needs a minimum of 8 at bats.
| Categories | Players | Statistics |
| At Bats | Rob Rader | 15 |
| Total Hits | Rob Rader | 14 |
| Home Runs | Joe Bachic | 4 |
| Runs Scored | Rob Rader | 13 |
| Runs Batted In | Joe Bachic | 16 |
| Offensive Potency Ratio | Joe Bachic | 2.077 |
| Batting Average | Tony Taylor | 1.000 |
| Doubles | Tony Taylor | 6 |
| Triples | Sean Absten | 2 |
| Walks | 5 players are tied with | 2 |
| On Base By Error | Chris Pastiva , Mike Plum , Rick Zatta | 1 |
| On Base Percentage | Tony Taylor | 1.000 |
| Slugging Percentage | Joe Bachic | 1.923 |
| Present Hitting Streak | 8 players are tied with | 4 |
| Longest Hitting Streak | 8 players are tied with | 4 |
| Sacrifice Flies | Chris Pastiva , Mike Plum , Frank Shrieves | 1 |
Joe Bachic GP= 2 AB= 7 H= 7 R= 6 RBI= 14 D= 1 T= 0 HR= 4 W= 0 SF= 0 OBBE= 0 OPR= 2.857 AVE= 1 SL%= 2.857
| Players | GP | PA | AB | H | R | RBI | D | T | HR | BB | K | SF | OBE | H/G | OPR | OB% | AVG | SLG% | OPS | HS | LHS | |
| 1 . | Anthony Sokolars. | 2 | 6 | 6 | 6 | 5 | 5 | 2 | 0 | 3 | 0 | 0 | 0 | 0 | 3.0 | 1.667 | 1.000 | 1.000 | 2.833 | 3.833 | 2 | 2 |
| 2 . | Dan Gallagher | 2 | 5 | 4 | 3 | 3 | 3 | 1 | 1 | 0 | 1 | 0 | 0 | 1 | 1.5 | 1.500 | 1.000 | 0.750 | 1.500 | 2.500 | 2 | 2 |
| 3 . | Dave Longano | 2 | 4 | 4 | 3 | 3 | 2 | 1 | 0 | 0 | 0 | 0 | 0 | 0 | 1.5 | 1.250 | 0.750 | 0.750 | 1.000 | 1.750 | 2 | 2 |
| 4 . | Dom Corrao | 4 | 12 | 11 | 8 | 6 | 1 | 0 | 0 | 0 | 0 | 0 | 1 | 0 | 2.0 | 0.636 | 0.727 | 0.727 | 0.727 | 1.455 | 4 | 4 |
| 5 . | Anthony Vitantoni | 4 | 10 | 9 | 6 | 3 | 3 | 3 | 0 | 0 | 1 | 0 | 0 | 1 | 1.5 | 0.667 | 0.800 | 0.667 | 1.000 | 1.800 | 4 | 4 |
| 6 . | Chris Nagy | 4 | 11 | 9 | 6 | 4 | 6 | 1 | 0 | 0 | 1 | 0 | 1 | 0 | 1.5 | 1.111 | 0.700 | 0.667 | 0.778 | 1.478 | 4 | 4 |
| 7 . | Scott Kokish | 4 | 12 | 11 | 7 | 8 | 8 | 0 | 1 | 3 | 1 | 0 | 0 | 1 | 1.8 | 1.455 | 0.750 | 0.636 | 1.636 | 2.386 | 1 | 2 |
| 8 . | S. Pooka | 2 | 5 | 5 | 3 | 1 | 6 | 1 | 0 | 1 | 0 | 0 | 0 | 0 | 1.5 | 1.400 | 0.600 | 0.600 | 1.400 | 2.000 | 2 | 2 |
| 9 . | Bob Daniels | 4 | 11 | 10 | 6 | 7 | 2 | 2 | 0 | 0 | 1 | 0 | 0 | 0 | 1.5 | 0.900 | 0.636 | 0.600 | 0.800 | 1.436 | 0 | 3 |
| 10 . | Gary Lence | 4 | 11 | 9 | 5 | 3 | 5 | 1 | 0 | 1 | 1 | 0 | 1 | 0 | 1.3 | 0.889 | 0.600 | 0.556 | 1.000 | 1.600 | 0 | 3 |
| 11 . | Jason Perron | 2 | 4 | 4 | 2 | 2 | 1 | 0 | 0 | 0 | 0 | 0 | 0 | 0 | 1.0 | 0.750 | 0.500 | 0.500 | 0.500 | 1.000 | 2 | 2 |
| 12 . | Lou Nemeth | 3 | 6 | 5 | 2 | 2 | 1 | 0 | 0 | 0 | 0 | 0 | 1 | 0 | 0.7 | 0.600 | 0.400 | 0.400 | 0.400 | 0.800 | 1 | 1 |
| 13 . | Joe Mazanec | 4 | 8 | 8 | 3 | 2 | 0 | 0 | 0 | 0 | 0 | 0 | 0 | 0 | 0.8 | 0.250 | 0.375 | 0.375 | 0.375 | 0.750 | 0 | 1 |
| 14 . | Ray Ondercin | 4 | 10 | 9 | 3 | 3 | 3 | 0 | 0 | 1 | 0 | 0 | 1 | 0 | 0.8 | 0.667 | 0.333 | 0.333 | 0.667 | 1.000 | 1 | 2 |
| 15 . | B. Mandato | 1 | 2 | 2 | 0 | 0 | 0 | 0 | 0 | 0 | 0 | 0 | 0 | 0 | 0.0 | 0.000 | 0.000 | 0.000 | 0.000 | 0.000 | 0 | 0 |
| TOTALS | 4 | 117 | 106 | 63 | 52 | 46 | 12 | 2 | 9 | 6 | 0 | 5 | 3 | 15.8 | 0.92 | 0.643 | 0.594 | 1.000 | 1.643 |
| Game 1 8/27 15- 4 DIVERSIF HOME |
Game 2 8/27 19- 3 DIVERSIF AWAY |
Game 3 9/10 12-22 PLUM PAL AWAY |
Game 4 9/10 6-24 PLUM PAL HOME |
| Runs Scored | Runs Allowed |
| 13.00
runs/game |
13.25
runs/game |
| Differential | |
| -0.25
runs/game |
|
| Infield Errors | Outfield Errors |
| 0 infield errors |
0 outfield errors |
| Total Errors | Errors/Game |
| 0 total errors |
0.000 errors/game |
OPR, AVG, OBP and SLG% needs a minimum of 8 at bats.
| Categories | Players | Statistics |
| At Bats | Dom Corrao , Scott Kokish | 11 |
| Total Hits | Dom Corrao | 8 |
| Home Runs | Scott Kokish , Anthony Sokolars. | 3 |
| Runs Scored | Scott Kokish | 8 |
| Runs Batted In | Scott Kokish | 8 |
| Offensive Potency Ratio | Scott Kokish | 1.455 |
| Batting Average | Dom Corrao | 0.727 |
| Doubles | Anthony Vitantoni | 3 |
| Triples | Dan Gallagher , Scott Kokish | 1 |
| Walks | 6 players are tied with | 1 |
| On Base By Error | Dan Gallagher , Scott Kokish , Anthony Vitantoni | 1 |
| On Base Percentage | Anthony Vitantoni | 0.800 |
| Slugging Percentage | Scott Kokish | 1.636 |
| Present Hitting Streak | Dom Corrao , Chris Nagy , Anthony Vitantoni | 4 |
| Longest Hitting Streak | Dom Corrao , Chris Nagy , Anthony Vitantoni | 4 |
| Sacrifice Flies | 5 players are tied with | 1 |
Dan Gallagher GP= 2 AB= 4 H= 3 R= 3 RBI= 3 D= 1 T= 1 HR= 0 W= 1 SF= 0 OBBE= 1 OPR= 1.5 AVE= .75 SL%= 1.5
| Players | GP | PA | AB | H | R | RBI | D | T | HR | BB | K | SF | OBE | H/G | OPR | OB% | AVG | SLG% | OPS | HS | LHS | |
| 1 . | Rob Whitehouse | 2 | 4 | 4 | 3 | 3 | 3 | 0 | 0 | 3 | 0 | 0 | 0 | 0 | 1.5 | 1.500 | 0.750 | 0.750 | 3.000 | 3.750 | 2 | 2 |
| 2 . | Gary Williams | 2 | 4 | 4 | 2 | 0 | 0 | 0 | 0 | 0 | 0 | 0 | 0 | 0 | 1.0 | 0.000 | 0.500 | 0.500 | 0.500 | 1.000 | 2 | 2 |
| 3 . | Ed Wilson | 2 | 4 | 4 | 2 | 1 | 1 | 0 | 0 | 0 | 0 | 0 | 0 | 1 | 1.0 | 0.500 | 0.750 | 0.500 | 0.500 | 1.250 | 2 | 2 |
| 4 . | Doug Agnew | 2 | 3 | 2 | 1 | 0 | 1 | 0 | 0 | 0 | 0 | 0 | 1 | 0 | 0.5 | 0.500 | 0.500 | 0.500 | 0.500 | 1.000 | 0 | 1 |
| 5 . | Rob Hollobaugh | 2 | 4 | 4 | 2 | 1 | 0 | 0 | 0 | 0 | 0 | 0 | 0 | 0 | 1.0 | 0.250 | 0.500 | 0.500 | 0.500 | 1.000 | 0 | 1 |
| 6 . | Bob Elliot | 2 | 5 | 5 | 2 | 0 | 0 | 0 | 1 | 0 | 0 | 0 | 0 | 0 | 1.0 | 0.000 | 0.400 | 0.400 | 0.800 | 1.200 | 0 | 1 |
| 7 . | Tim Lackner | 2 | 3 | 3 | 1 | 0 | 0 | 0 | 0 | 0 | 0 | 0 | 0 | 0 | 0.5 | 0.000 | 0.333 | 0.333 | 0.333 | 0.667 | 0 | 1 |
| 8 . | Mike Reifsnyder | 2 | 5 | 5 | 1 | 2 | 1 | 0 | 0 | 1 | 0 | 0 | 0 | 0 | 0.5 | 0.600 | 0.200 | 0.200 | 0.800 | 1.000 | 1 | 1 |
| 9 . | Joe LaManna | 2 | 2 | 2 | 0 | 0 | 0 | 0 | 0 | 0 | 0 | 0 | 0 | 0 | 0.0 | 0.000 | 0.000 | 0.000 | 0.000 | 0.000 | 0 | 0 |
| 10 . | Mike Futchi | 1 | 0 | 0 | 0 | 0 | 0 | 0 | 0 | 0 | 0 | 0 | 0 | 0 | 0.0 | 0.000 | 0.000 | 0.000 | 0.000 | 0.000 | 0 | 0 |
| 11 . | Emillio DiBiasio | 2 | 3 | 2 | 0 | 0 | 1 | 0 | 0 | 0 | 0 | 0 | 1 | 0 | 0.0 | 0.500 | 0.000 | 0.000 | 0.000 | 0.000 | 0 | 0 |
| 12 . | Tom May | 2 | 3 | 3 | 0 | 0 | 0 | 0 | 0 | 0 | 0 | 0 | 0 | 0 | 0.0 | 0.000 | 0.000 | 0.000 | 0.000 | 0.000 | 0 | 0 |
| TOTALS | 2 | 40 | 38 | 14 | 7 | 7 | 0 | 1 | 4 | 0 | 0 | 2 | 1 | 7.0 | 0.37 | 0.395 | 0.368 | 0.737 | 1.132 |
| Game 1 8/27 4-15 KOK SENI AWAY |
Game 2 8/27 3-19 KOK SENI HOME |
| Runs Scored | Runs Allowed |
| 3.50
runs/game |
17.00
runs/game |
| Differential | |
| -13.50
runs/game |
|
| Infield Errors | Outfield Errors |
| 0 infield errors |
0 outfield errors |
| Total Errors | Errors/Game |
| 0 total errors |
0.000 errors/game |
OPR, AVG, OBP and SLG% needs a minimum of 4 at bats.
| Categories | Players | Statistics |
| At Bats | Bob Elliot , Mike Reifsnyder | 5 |
| Total Hits | Rob Whitehouse | 3 |
| Home Runs | Rob Whitehouse | 3 |
| Runs Scored | Rob Whitehouse | 3 |
| Runs Batted In | Rob Whitehouse | 3 |
| Offensive Potency Ratio | Rob Whitehouse | 1.500 |
| Batting Average | Rob Whitehouse | 0.750 |
| Doubles | NO ONE HAS ANY | 0 |
| Triples | Bob Elliot | 1 |
| Walks | NO ONE HAS ANY | 0 |
| On Base By Error | Ed Wilson | 1 |
| On Base Percentage | Rob Whitehouse , Ed Wilson | 0.750 |
| Slugging Percentage | Rob Whitehouse | 3.000 |
| Present Hitting Streak | Rob Whitehouse , Gary Williams , Ed Wilson | 2 |
| Longest Hitting Streak | Rob Whitehouse , Gary Williams , Ed Wilson | 2 |
| Sacrifice Flies | Emillio DiBiasio , Doug Agnew | 1 |
SORRY, NO ONE QUALIFIEDGP= 0 AB= 0 H= 0 R= 0 RBI= 0 D= 0 T= 0 HR= 0 W= 0 SF= 0 OBBE= 0 OPR= 0 AVE= 0 SL%= 0
| Players | GP | PA | AB | H | R | RBI | D | T | HR | BB | K | SF | OBE | H/G | OPR | OB% | AVG | SLG% | OPS | HS | LHS | |
| 1 . | Marcus Fishwick | 2 | 12 | 12 | 12 | 6 | 15 | 1 | 0 | 2 | 0 | 0 | 0 | 0 | 6.0 | 1.750 | 1.000 | 1.000 | 1.583 | 2.583 | 2 | 2 |
| 2 . | Bruce Richert | 2 | 11 | 10 | 8 | 3 | 5 | 0 | 0 | 0 | 0 | 0 | 1 | 0 | 4.0 | 0.800 | 0.800 | 0.800 | 0.800 | 1.600 | 2 | 2 |
| 3 . | Tim Carney | 2 | 11 | 10 | 7 | 4 | 5 | 0 | 0 | 0 | 1 | 0 | 0 | 0 | 3.5 | 0.900 | 0.727 | 0.700 | 0.700 | 1.427 | 2 | 2 |
| 4 . | Bill Malovrh | 2 | 11 | 10 | 7 | 4 | 4 | 0 | 2 | 0 | 0 | 0 | 1 | 0 | 3.5 | 0.800 | 0.700 | 0.700 | 1.100 | 1.800 | 2 | 2 |
| 5 . | Craig Lemponen | 2 | 12 | 12 | 8 | 6 | 2 | 1 | 0 | 0 | 0 | 0 | 0 | 0 | 4.0 | 0.667 | 0.667 | 0.667 | 0.750 | 1.417 | 2 | 2 |
| 6 . | Paul Jonke | 2 | 12 | 8 | 5 | 6 | 2 | 3 | 0 | 0 | 4 | 0 | 0 | 0 | 2.5 | 1.000 | 0.750 | 0.625 | 1.000 | 1.750 | 2 | 2 |
| 7 . | Brian Kerns | 2 | 11 | 11 | 6 | 6 | 4 | 1 | 0 | 1 | 0 | 0 | 0 | 1 | 3.0 | 0.909 | 0.636 | 0.545 | 0.909 | 1.545 | 2 | 2 |
| 8 . | Frank Piazza | 2 | 12 | 11 | 5 | 5 | 2 | 0 | 0 | 0 | 0 | 0 | 1 | 0 | 2.5 | 0.636 | 0.455 | 0.455 | 0.455 | 0.909 | 2 | 2 |
| 9 . | Brian Levon | 2 | 12 | 11 | 5 | 3 | 4 | 0 | 0 | 0 | 0 | 0 | 1 | 0 | 2.5 | 0.636 | 0.455 | 0.455 | 0.455 | 0.909 | 2 | 2 |
| TOTALS | 2 | 104 | 95 | 63 | 43 | 43 | 6 | 2 | 3 | 5 | 0 | 4 | 1 | 31.5 | 0.91 | 0.690 | 0.663 | 0.863 | 1.553 |
| Game 1 8/27 24-25 TCC/KMB AWAY |
Game 2 8/27 19-27 TCC/KMB HOME |
| Runs Scored | Runs Allowed |
| 21.50
runs/game |
26.00
runs/game |
| Differential | |
| -4.50
runs/game |
|
| Infield Errors | Outfield Errors |
| 0 infield errors |
0 outfield errors |
| Total Errors | Errors/Game |
| 0 total errors |
0.000 errors/game |
OPR, AVG, OBP and SLG% needs a minimum of 4 at bats.
| Categories | Players | Statistics |
| At Bats | Marcus Fishwick , Craig Lemponen | 12 |
| Total Hits | Marcus Fishwick | 12 |
| Home Runs | Marcus Fishwick | 2 |
| Runs Scored | 4 players are tied with | 6 |
| Runs Batted In | Marcus Fishwick | 15 |
| Offensive Potency Ratio | Marcus Fishwick | 1.750 |
| Batting Average | Marcus Fishwick | 1.000 |
| Doubles | Paul Jonke | 3 |
| Triples | Bill Malovrh | 2 |
| Walks | Paul Jonke | 4 |
| On Base By Error | Brian Kerns | 1 |
| On Base Percentage | Marcus Fishwick | 1.000 |
| Slugging Percentage | Marcus Fishwick | 1.583 |
| Present Hitting Streak | 9 players are tied with | 2 |
| Longest Hitting Streak | 9 players are tied with | 2 |
| Sacrifice Flies | 4 players are tied with | 1 |
SORRY, NO ONE QUALIFIEDGP= 0 AB= 0 H= 0 R= 0 RBI= 0 D= 0 T= 0 HR= 0 W= 0 SF= 0 OBBE= 0 OPR= 0 AVE= 0 SL%= 0
| Players | GP | PA | AB | H | R | RBI | D | T | HR | BB | K | SF | OBE | H/G | OPR | OB% | AVG | SLG% | OPS | HS | LHS | |
| 1 . | Craig Ellis | 4 | 18 | 14 | 12 | 8 | 9 | 4 | 1 | 0 | 4 | 0 | 0 | 0 | 3.0 | 1.214 | 0.889 | 0.857 | 1.286 | 2.175 | 4 | 4 |
| 2 . | Rico Rivera | 4 | 18 | 17 | 14 | 9 | 8 | 2 | 3 | 0 | 1 | 0 | 0 | 0 | 3.5 | 1.000 | 0.833 | 0.824 | 1.294 | 2.127 | 4 | 4 |
| 3 . | Thomas Threat | 4 | 16 | 14 | 10 | 8 | 7 | 1 | 0 | 1 | 2 | 0 | 0 | 0 | 2.5 | 1.071 | 0.750 | 0.714 | 1.000 | 1.750 | 4 | 4 |
| 4 . | Rashaad Steven | 4 | 17 | 14 | 9 | 8 | 5 | 3 | 1 | 1 | 3 | 0 | 0 | 0 | 2.3 | 0.929 | 0.706 | 0.643 | 1.214 | 1.920 | 1 | 2 |
| 5 . | Joe Fullove | 4 | 19 | 16 | 10 | 14 | 6 | 1 | 1 | 1 | 3 | 0 | 0 | 2 | 2.5 | 1.250 | 0.789 | 0.625 | 1.000 | 1.789 | 4 | 4 |
| 6 . | Bryant Thomas | 4 | 15 | 15 | 9 | 5 | 7 | 7 | 0 | 0 | 0 | 0 | 0 | 0 | 2.3 | 0.800 | 0.600 | 0.600 | 1.067 | 1.667 | 4 | 4 |
| 7 . | Ant Morris | 4 | 15 | 14 | 8 | 5 | 3 | 4 | 0 | 0 | 1 | 0 | 0 | 1 | 2.0 | 0.571 | 0.667 | 0.571 | 0.857 | 1.524 | 4 | 4 |
| 8 . | Reggie Farmer | 4 | 14 | 14 | 8 | 4 | 4 | 1 | 1 | 0 | 0 | 0 | 0 | 1 | 2.0 | 0.571 | 0.643 | 0.571 | 0.786 | 1.429 | 1 | 2 |
| 9 . | Greg Trivisono | 2 | 11 | 10 | 5 | 4 | 5 | 0 | 1 | 0 | 0 | 0 | 1 | 0 | 2.5 | 0.900 | 0.500 | 0.500 | 0.700 | 1.200 | 2 | 2 |
| 10 . | Mike Tolar | 3 | 13 | 10 | 4 | 3 | 6 | 2 | 0 | 0 | 2 | 0 | 1 | 1 | 1.3 | 0.900 | 0.583 | 0.400 | 0.600 | 1.183 | 1 | 1 |
| 11 . | Curtis Young | 2 | 8 | 8 | 3 | 0 | 2 | 0 | 0 | 0 | 0 | 0 | 0 | 0 | 1.5 | 0.250 | 0.375 | 0.375 | 0.375 | 0.750 | 1 | 1 |
| TOTALS | 4 | 164 | 146 | 92 | 70 | 62 | 25 | 8 | 3 | 16 | 0 | 2 | 5 | 23.0 | 0.90 | 0.698 | 0.630 | 0.973 | 1.670 |
| Game 1 8/27 25-24 MISFITS HOME |
Game 2 8/27 27-19 MISFITS AWAY |
Game 3 9/ 3 7-18 PLUM PAL AWAY |
Game 4 9/ 3 11-20 PLUM PAL HOME |
| Runs Scored | Runs Allowed |
| 17.50
runs/game |
20.25
runs/game |
| Differential | |
| -2.75
runs/game |
|
| Infield Errors | Outfield Errors |
| 0 infield errors |
0 outfield errors |
| Total Errors | Errors/Game |
| 0 total errors |
0.000 errors/game |
OPR, AVG, OBP and SLG% needs a minimum of 8 at bats.
| Categories | Players | Statistics |
| At Bats | Rico Rivera | 17 |
| Total Hits | Rico Rivera | 14 |
| Home Runs | Joe Fullove , Rashaad Steven , Thomas Threat | 1 |
| Runs Scored | Joe Fullove | 14 |
| Runs Batted In | Craig Ellis | 9 |
| Offensive Potency Ratio | Joe Fullove | 1.250 |
| Batting Average | Craig Ellis | 0.857 |
| Doubles | Bryant Thomas | 7 |
| Triples | Rico Rivera | 3 |
| Walks | Craig Ellis | 4 |
| On Base By Error | Joe Fullove | 2 |
| On Base Percentage | Craig Ellis | 0.889 |
| Slugging Percentage | Rico Rivera | 1.294 |
| Present Hitting Streak | 6 players are tied with | 4 |
| Longest Hitting Streak | 6 players are tied with | 4 |
| Sacrifice Flies | Mike Tolar , Greg Trivisono | 1 |
SORRY, NO ONE QUALIFIEDGP= 0 AB= 0 H= 0 R= 0 RBI= 0 D= 0 T= 0 HR= 0 W= 0 SF= 0 OBBE= 0 OPR= 0 AVE= 0 SL%= 0
| Teams | GP | W | L | T | R/G | RA/G | RD/G | PCT | LWS | PS | GB |
| 1. PLUM PALS | 4 | 4 | 0 | 0 | 21.0 | 9.0 | +12.0 | 1.000 | 4 | 4W | 0.0 |
| 2. KOK SENIOR SOFTBALL | 4 | 2 | 2 | 0 | 13.0 | 13.3 | -0.3 | 0.500 | 2 | 2L | 2.0 |
| 3. TCC/KMB | 4 | 2 | 2 | 0 | 17.5 | 20.3 | -2.8 | 0.500 | 2 | 2L | 2.0 |
| 4. MISFITS | 2 | 0 | 2 | 0 | 21.5 | 26.0 | -4.5 | 0.000 | 0 | 2L | 3.0 |
| 5. DIVERSIFIED MACHINE | 2 | 0 | 2 | 0 | 3.5 | 17.0 | -13.5 | 0.000 | 0 | 2L | 3.0 |
| Teams | AB | H | H/G | D | T | HR | BB | SF | RF | RA | OB% | SLG% | AVG |
| 1. PLUM PALS | 134 | 96 | 24.0 | 27 | 5 | 6 | 14 | 3 | 84 | 36 | 0.743 | 1.127 | 0.716 |
| 2. MISFITS | 95 | 63 | 31.5 | 6 | 2 | 3 | 5 | 4 | 43 | 52 | 0.680 | 0.863 | 0.663 |
| 3. TCC/KMB | 146 | 92 | 23.0 | 25 | 8 | 3 | 16 | 2 | 70 | 81 | 0.667 | 0.973 | 0.630 |
| 4. KOK SENIOR SOFTBALL | 106 | 63 | 15.8 | 12 | 2 | 9 | 6 | 5 | 52 | 53 | 0.616 | 1.000 | 0.594 |
| 5. DIVERSIFIED MACHINE | 38 | 14 | 7.0 | 0 | 1 | 4 | 0 | 2 | 7 | 34 | 0.368 | 0.737 | 0.368 |
| Teams | GP | IF E | OF E | Tot E | E/G | Home | Away | BO | ClGm | DefGem | PowSrg |
| 1. PLUM PALS | 4 | 0 | 0 | 0 | 0.000 | 2 - 0 - 0 | 2 - 0 - 0 | 1 - 0 | 0 - 0 - 0 | 0 | 4 |
| 2. KOK SENIOR SOFTBALL | 4 | 0 | 0 | 0 | 0.000 | 1 - 1 - 0 | 1 - 1 - 0 | 1 - 1 | 0 - 0 - 0 | 2 | 1 |
| 3. DIVERSIFIED MACHINE | 2 | 0 | 0 | 0 | 0.000 | 0 - 1 - 0 | 0 - 1 - 0 | 0 - 1 | 0 - 0 - 0 | 0 | 0 |
| 4. MISFITS | 2 | 0 | 0 | 0 | 0.000 | 0 - 1 - 0 | 0 - 1 - 0 | 0 - 0 | 0 - 1 - 0 | 0 | 2 |
| 5. TCC/KMB | 4 | 0 | 0 | 0 | 0.000 | 1 - 1 - 0 | 1 - 1 - 0 | 0 - 0 | 1 - 0 - 0 | 0 | 2 |
Blowouts (BO): Record in Games decided by 12 or more runs.
Close Games (ClGm): Record in Games decided by 4 or fewer runs.
Defensive Gems (DefGem): Games holding opponents to 4 or fewer runs.
Power Surge (PowSrg): Games scoring 18 or more runs.
| Players | Team | AB | H | PHS | LHS | AVG | |
| 1. | Marcus Fishwick | MISFITS | 12 | 12 | 2 | 2 | 1.000 |
| 2. | Tony Taylor | PLUM PALS | 13 | 13 | 4 | 4 | 1.000 |
| 3. | Rob Rader | PLUM PALS | 15 | 14 | 4 | 4 | 0.933 |
| 4. | Joe Bachic | PLUM PALS | 13 | 12 | 4 | 4 | 0.923 |
| 5. | Craig Ellis | TCC/KMB | 14 | 12 | 4 | 4 | 0.857 |
| 6. | Rico Rivera | TCC/KMB | 17 | 14 | 4 | 4 | 0.824 |
| 7. | Rick Cassidy | PLUM PALS | 11 | 9 | 4 | 4 | 0.818 |
| 8. | Bruce Richert | MISFITS | 10 | 8 | 2 | 2 | 0.800 |
| 9. | Dom Corrao | KOK SENIOR SOFTBALL | 11 | 8 | 4 | 4 | 0.727 |
| 10. | Thomas Threat | TCC/KMB | 14 | 10 | 4 | 4 | 0.714 |
| 11. | Bill Malovrh | MISFITS | 10 | 7 | 2 | 2 | 0.700 |
| 12. | Tim Carney | MISFITS | 10 | 7 | 2 | 2 | 0.700 |
| 13. | Anthony Vitantoni | KOK SENIOR SOFTBALL | 9 | 6 | 4 | 4 | 0.667 |
| 14. | Craig Lemponen | MISFITS | 12 | 8 | 2 | 2 | 0.667 |
| 15. | Sean Absten | PLUM PALS | 12 | 8 | 4 | 4 | 0.667 |
| 16. | Chris Nagy | KOK SENIOR SOFTBALL | 9 | 6 | 4 | 4 | 0.667 |
| 17. | Rashaad Steven | TCC/KMB | 14 | 9 | 1 | 2 | 0.643 |
| 18. | Scott Kokish | KOK SENIOR SOFTBALL | 11 | 7 | 1 | 2 | 0.636 |
| 19. | Joe Fullove | TCC/KMB | 16 | 10 | 4 | 4 | 0.625 |
| 20. | Paul Jonke | MISFITS | 8 | 5 | 2 | 2 | 0.625 |
| 21. | Bob Daniels | KOK SENIOR SOFTBALL | 10 | 6 | 0 | 3 | 0.600 |
| 22. | Matt Damsa | PLUM PALS | 10 | 6 | 0 | 3 | 0.600 |
| 23. | Mike Plum | PLUM PALS | 10 | 6 | 4 | 4 | 0.600 |
| 24. | Bryant Thomas | TCC/KMB | 15 | 9 | 4 | 4 | 0.600 |
| 25. | Chris Pastiva | PLUM PALS | 12 | 7 | 4 | 4 | 0.583 |
| 26. | Ant Morris | TCC/KMB | 14 | 8 | 4 | 4 | 0.571 |
| 27. | Reggie Farmer | TCC/KMB | 14 | 8 | 1 | 2 | 0.571 |
| 28. | Gary Lence | KOK SENIOR SOFTBALL | 9 | 5 | 0 | 3 | 0.556 |
| 29. | Brian Kerns | MISFITS | 11 | 6 | 2 | 2 | 0.545 |
| 30. | Rick Zatta | PLUM PALS | 13 | 7 | 4 | 4 | 0.538 |
| Players | Team | AB | RUNS | RBI | OPR | |
| 1. | Joe Bachic | PLUM PALS | 13 | 11 | 16 | 2.077 |
| 2. | Marcus Fishwick | MISFITS | 12 | 6 | 15 | 1.750 |
| 3. | Rick Cassidy | PLUM PALS | 11 | 9 | 9 | 1.636 |
| 4. | Tony Taylor | PLUM PALS | 13 | 9 | 10 | 1.462 |
| 5. | Scott Kokish | KOK SENIOR SOFTBALL | 11 | 8 | 8 | 1.455 |
| 6. | Rob Rader | PLUM PALS | 15 | 13 | 7 | 1.333 |
| 7. | Joe Fullove | TCC/KMB | 16 | 14 | 6 | 1.250 |
| 8. | Sean Absten | PLUM PALS | 12 | 4 | 11 | 1.250 |
| 9. | Craig Ellis | TCC/KMB | 14 | 8 | 9 | 1.214 |
| 10. | Chris Nagy | KOK SENIOR SOFTBALL | 9 | 4 | 6 | 1.111 |
| 11. | Thomas Threat | TCC/KMB | 14 | 8 | 7 | 1.071 |
| 12. | Paul Jonke | MISFITS | 8 | 6 | 2 | 1.000 |
| 13. | Rick Zatta | PLUM PALS | 13 | 8 | 5 | 1.000 |
| 14. | Rico Rivera | TCC/KMB | 17 | 9 | 8 | 1.000 |
| 15. | Rashaad Steven | TCC/KMB | 14 | 8 | 5 | 0.929 |
| 16. | Chris Pastiva | PLUM PALS | 12 | 9 | 2 | 0.917 |
| 17. | Brian Kerns | MISFITS | 11 | 6 | 4 | 0.909 |
| 18. | Tim Carney | MISFITS | 10 | 4 | 5 | 0.900 |
| 19. | Mike Tolar | TCC/KMB | 10 | 3 | 6 | 0.900 |
| 20. | Greg Trivisono | TCC/KMB | 10 | 4 | 5 | 0.900 |
| 21. | Matt Damsa | PLUM PALS | 10 | 6 | 3 | 0.900 |
| 22. | Bob Daniels | KOK SENIOR SOFTBALL | 10 | 7 | 2 | 0.900 |
| 23. | Gary Lence | KOK SENIOR SOFTBALL | 9 | 3 | 5 | 0.889 |
| 24. | Bruce Richert | MISFITS | 10 | 3 | 5 | 0.800 |
| 25. | Mike Plum | PLUM PALS | 10 | 5 | 3 | 0.800 |
| 26. | Bryant Thomas | TCC/KMB | 15 | 5 | 7 | 0.800 |
| 27. | Bill Malovrh | MISFITS | 10 | 4 | 4 | 0.800 |
| 28. | Craig Lemponen | MISFITS | 12 | 6 | 2 | 0.667 |
| 29. | Anthony Vitantoni | KOK SENIOR SOFTBALL | 9 | 3 | 3 | 0.667 |
| 30. | Ray Ondercin | KOK SENIOR SOFTBALL | 9 | 3 | 3 | 0.667 |
| Players | Team | AB | HR | HR/AB | |
| 1. | Joe Bachic | PLUM PALS | 13 | 4 | 0.308 |
| 2. | Rob Whitehouse | DIVERSIFIED MACHINE | 4 | 3 | 0.750 |
| 3. | Scott Kokish | KOK SENIOR SOFTBALL | 11 | 3 | 0.273 |
| 4. | Anthony Sokolars. | KOK SENIOR SOFTBALL | 6 | 3 | 0.500 |
| 5. | Marcus Fishwick | MISFITS | 12 | 2 | 0.167 |
| 6. | Mike Reifsnyder | DIVERSIFIED MACHINE | 5 | 1 | 0.200 |
| 7. | Brian Kerns | MISFITS | 11 | 1 | 0.091 |
| 8. | Joe Fullove | TCC/KMB | 16 | 1 | 0.063 |
| 9. | Rashaad Steven | TCC/KMB | 14 | 1 | 0.071 |
| 10. | Thomas Threat | TCC/KMB | 14 | 1 | 0.071 |
| 11. | Rick Zatta | PLUM PALS | 13 | 1 | 0.077 |
| 12. | Gary Lence | KOK SENIOR SOFTBALL | 9 | 1 | 0.111 |
| 13. | Ray Ondercin | KOK SENIOR SOFTBALL | 9 | 1 | 0.111 |
| 14. | S. Pooka | KOK SENIOR SOFTBALL | 5 | 1 | 0.200 |
| 15. | Tony Taylor | PLUM PALS | 13 | 1 | 0.077 |
| Players | Team | AB | RBI | RBI/AB | |
| 1. | Joe Bachic | PLUM PALS | 13 | 16 | 1.231 |
| 2. | Marcus Fishwick | MISFITS | 12 | 15 | 1.250 |
| 3. | Sean Absten | PLUM PALS | 12 | 11 | 0.917 |
| 4. | Tony Taylor | PLUM PALS | 13 | 10 | 0.769 |
| 5. | Rick Cassidy | PLUM PALS | 11 | 9 | 0.818 |
| 6. | Craig Ellis | TCC/KMB | 14 | 9 | 0.643 |
| 7. | Rico Rivera | TCC/KMB | 17 | 8 | 0.471 |
| 8. | Scott Kokish | KOK SENIOR SOFTBALL | 11 | 8 | 0.727 |
| 9. | Thomas Threat | TCC/KMB | 14 | 7 | 0.500 |
| 10. | Bryant Thomas | TCC/KMB | 15 | 7 | 0.467 |
| 11. | Rob Rader | PLUM PALS | 15 | 7 | 0.467 |
| 12. | S. Pooka | KOK SENIOR SOFTBALL | 5 | 6 | 1.200 |
| 13. | Chris Nagy | KOK SENIOR SOFTBALL | 9 | 6 | 0.667 |
| 14. | Mike Tolar | TCC/KMB | 10 | 6 | 0.600 |
| 15. | Joe Fullove | TCC/KMB | 16 | 6 | 0.375 |
| 16. | Greg Trivisono | TCC/KMB | 10 | 5 | 0.500 |
| 17. | Anthony Sokolars. | KOK SENIOR SOFTBALL | 6 | 5 | 0.833 |
| 18. | Tim Carney | MISFITS | 10 | 5 | 0.500 |
| 19. | Gary Lence | KOK SENIOR SOFTBALL | 9 | 5 | 0.556 |
| 20. | Bruce Richert | MISFITS | 10 | 5 | 0.500 |
| 21. | Rick Zatta | PLUM PALS | 13 | 5 | 0.385 |
| 22. | Rashaad Steven | TCC/KMB | 14 | 5 | 0.357 |
| 23. | Brian Kerns | MISFITS | 11 | 4 | 0.364 |
| 24. | Brian Levon | MISFITS | 11 | 4 | 0.364 |
| 25. | Bill Malovrh | MISFITS | 10 | 4 | 0.400 |
| 26. | Reggie Farmer | TCC/KMB | 14 | 4 | 0.286 |
| 27. | Rob Whitehouse | DIVERSIFIED MACHINE | 4 | 3 | 0.750 |
| 28. | Frank Shrieves | PLUM PALS | 11 | 3 | 0.273 |
| 29. | Bobby Woodry | PLUM PALS | 4 | 3 | 0.750 |
| 30. | Anthony Vitantoni | KOK SENIOR SOFTBALL | 9 | 3 | 0.333 |
| Players | Team | AB | RUNS | R/AB | |
| 1. | Joe Fullove | TCC/KMB | 16 | 14 | 0.875 |
| 2. | Rob Rader | PLUM PALS | 15 | 13 | 0.867 |
| 3. | Joe Bachic | PLUM PALS | 13 | 11 | 0.846 |
| 4. | Rico Rivera | TCC/KMB | 17 | 9 | 0.529 |
| 5. | Rick Cassidy | PLUM PALS | 11 | 9 | 0.818 |
| 6. | Tony Taylor | PLUM PALS | 13 | 9 | 0.692 |
| 7. | Chris Pastiva | PLUM PALS | 12 | 9 | 0.750 |
| 8. | Scott Kokish | KOK SENIOR SOFTBALL | 11 | 8 | 0.727 |
| 9. | Rashaad Steven | TCC/KMB | 14 | 8 | 0.571 |
| 10. | Rick Zatta | PLUM PALS | 13 | 8 | 0.615 |
| 11. | Thomas Threat | TCC/KMB | 14 | 8 | 0.571 |
| 12. | Craig Ellis | TCC/KMB | 14 | 8 | 0.571 |
| 13. | Bob Daniels | KOK SENIOR SOFTBALL | 10 | 7 | 0.700 |
| 14. | Craig Lemponen | MISFITS | 12 | 6 | 0.500 |
| 15. | Brian Kerns | MISFITS | 11 | 6 | 0.545 |
| 16. | Matt Damsa | PLUM PALS | 10 | 6 | 0.600 |
| 17. | Marcus Fishwick | MISFITS | 12 | 6 | 0.500 |
| 18. | Dom Corrao | KOK SENIOR SOFTBALL | 11 | 6 | 0.545 |
| 19. | Paul Jonke | MISFITS | 8 | 6 | 0.750 |
| 20. | Mike Plum | PLUM PALS | 10 | 5 | 0.500 |
| Players | Team | AB | DOUBLES | DOUBLES/AB | |
| 1. | Bryant Thomas | TCC/KMB | 15 | 7 | 0.467 |
| 2. | Tony Taylor | PLUM PALS | 13 | 6 | 0.462 |
| 3. | Craig Ellis | TCC/KMB | 14 | 4 | 0.286 |
| 4. | Rob Rader | PLUM PALS | 15 | 4 | 0.267 |
| 5. | Ant Morris | TCC/KMB | 14 | 4 | 0.286 |
| 6. | Anthony Vitantoni | KOK SENIOR SOFTBALL | 9 | 3 | 0.333 |
| 7. | Paul Jonke | MISFITS | 8 | 3 | 0.375 |
| 8. | Frank Shrieves | PLUM PALS | 11 | 3 | 0.273 |
| 9. | Rashaad Steven | TCC/KMB | 14 | 3 | 0.214 |
| 10. | Rick Zatta | PLUM PALS | 13 | 3 | 0.231 |
| 11. | Chris Pastiva | PLUM PALS | 12 | 3 | 0.250 |
| 12. | Rico Rivera | TCC/KMB | 17 | 2 | 0.118 |
| 13. | Dan Woodson | PLUM PALS | 5 | 2 | 0.400 |
| 14. | Rick Cassidy | PLUM PALS | 11 | 2 | 0.182 |
| 15. | Anthony Sokolars. | KOK SENIOR SOFTBALL | 6 | 2 | 0.333 |
| 16. | Bob Daniels | KOK SENIOR SOFTBALL | 10 | 2 | 0.200 |
| 17. | Sean Absten | PLUM PALS | 12 | 2 | 0.167 |
| 18. | Mike Tolar | TCC/KMB | 10 | 2 | 0.200 |
| 19. | Marcus Fishwick | MISFITS | 12 | 1 | 0.083 |
| 20. | S. Pooka | KOK SENIOR SOFTBALL | 5 | 1 | 0.200 |
| Players | Team | AB | Triples | Triples/AB | |
| 1. | Rico Rivera | TCC/KMB | 17 | 3 | 0.176 |
| 2. | Bill Malovrh | MISFITS | 10 | 2 | 0.200 |
| 3. | Sean Absten | PLUM PALS | 12 | 2 | 0.167 |
| 4. | Reggie Farmer | TCC/KMB | 14 | 1 | 0.071 |
| 5. | Joe Fullove | TCC/KMB | 16 | 1 | 0.063 |
| 6. | Craig Ellis | TCC/KMB | 14 | 1 | 0.071 |
| 7. | Rashaad Steven | TCC/KMB | 14 | 1 | 0.071 |
| 8. | Greg Trivisono | TCC/KMB | 10 | 1 | 0.100 |
| 9. | Matt Damsa | PLUM PALS | 10 | 1 | 0.100 |
| 10. | Rick Zatta | PLUM PALS | 13 | 1 | 0.077 |
| 11. | Bobby Woodry | PLUM PALS | 4 | 1 | 0.250 |
| 12. | Dan Gallagher | KOK SENIOR SOFTBALL | 4 | 1 | 0.250 |
| 13. | Scott Kokish | KOK SENIOR SOFTBALL | 11 | 1 | 0.091 |
| 14. | Bob Elliot | DIVERSIFIED MACHINE | 5 | 1 | 0.200 |
| Players | Team | AB | H | 1B | 2B | 3B | HR | SLG% | |
| 1. | Joe Bachic | PLUM PALS | 13 | 12 | 7 | 1 | 0 | 4 | 1.923 |
| 2. | Tony Taylor | PLUM PALS | 13 | 13 | 6 | 6 | 0 | 1 | 1.692 |
| 3. | Scott Kokish | KOK SENIOR SOFTBALL | 11 | 7 | 3 | 0 | 1 | 3 | 1.636 |
| 4. | Marcus Fishwick | MISFITS | 12 | 12 | 9 | 1 | 0 | 2 | 1.583 |
| 5. | Rico Rivera | TCC/KMB | 17 | 14 | 9 | 2 | 3 | 0 | 1.294 |
| 6. | Craig Ellis | TCC/KMB | 14 | 12 | 7 | 4 | 1 | 0 | 1.286 |
| 7. | Rashaad Steven | TCC/KMB | 14 | 9 | 4 | 3 | 1 | 1 | 1.214 |
| 8. | Rob Rader | PLUM PALS | 15 | 14 | 10 | 4 | 0 | 0 | 1.200 |
| 9. | Sean Absten | PLUM PALS | 12 | 8 | 4 | 2 | 2 | 0 | 1.167 |
| 10. | Rick Zatta | PLUM PALS | 13 | 7 | 2 | 3 | 1 | 1 | 1.154 |
| 11. | Bill Malovrh | MISFITS | 10 | 7 | 5 | 0 | 2 | 0 | 1.100 |
| 12. | Bryant Thomas | TCC/KMB | 15 | 9 | 2 | 7 | 0 | 0 | 1.067 |
| 13. | Joe Fullove | TCC/KMB | 16 | 10 | 7 | 1 | 1 | 1 | 1.000 |
| 14. | Anthony Vitantoni | KOK SENIOR SOFTBALL | 9 | 6 | 3 | 3 | 0 | 0 | 1.000 |
| 15. | Paul Jonke | MISFITS | 8 | 5 | 2 | 3 | 0 | 0 | 1.000 |
| 16. | Thomas Threat | TCC/KMB | 14 | 10 | 8 | 1 | 0 | 1 | 1.000 |
| 17. | Rick Cassidy | PLUM PALS | 11 | 9 | 7 | 2 | 0 | 0 | 1.000 |
| 18. | Gary Lence | KOK SENIOR SOFTBALL | 9 | 5 | 3 | 1 | 0 | 1 | 1.000 |
| 19. | Brian Kerns | MISFITS | 11 | 6 | 4 | 1 | 0 | 1 | 0.909 |
| 20. | Matt Damsa | PLUM PALS | 10 | 6 | 4 | 1 | 1 | 0 | 0.900 |
| 21. | Ant Morris | TCC/KMB | 14 | 8 | 4 | 4 | 0 | 0 | 0.857 |
| 22. | Chris Pastiva | PLUM PALS | 12 | 7 | 4 | 3 | 0 | 0 | 0.833 |
| 23. | Bruce Richert | MISFITS | 10 | 8 | 8 | 0 | 0 | 0 | 0.800 |
| 24. | Bob Daniels | KOK SENIOR SOFTBALL | 10 | 6 | 4 | 2 | 0 | 0 | 0.800 |
| 25. | Reggie Farmer | TCC/KMB | 14 | 8 | 6 | 1 | 1 | 0 | 0.786 |
| 26. | Chris Nagy | KOK SENIOR SOFTBALL | 9 | 6 | 5 | 1 | 0 | 0 | 0.778 |
| 27. | Craig Lemponen | MISFITS | 12 | 8 | 7 | 1 | 0 | 0 | 0.750 |
| 28. | Frank Shrieves | PLUM PALS | 11 | 5 | 2 | 3 | 0 | 0 | 0.727 |
| 29. | Dom Corrao | KOK SENIOR SOFTBALL | 11 | 8 | 8 | 0 | 0 | 0 | 0.727 |
| 30. | Tim Carney | MISFITS | 10 | 7 | 7 | 0 | 0 | 0 | 0.700 |
| Players | Team | AB | BB | BB/AB | |
| 1. | Paul Jonke | MISFITS | 8 | 4 | 0.500 |
| 2. | Craig Ellis | TCC/KMB | 14 | 4 | 0.286 |
| 3. | Joe Fullove | TCC/KMB | 16 | 3 | 0.188 |
| 4. | Rashaad Steven | TCC/KMB | 14 | 3 | 0.214 |
| 5. | Mike Tolar | TCC/KMB | 10 | 2 | 0.200 |
| 6. | Sean Absten | PLUM PALS | 12 | 2 | 0.167 |
| 7. | Chris Pastiva | PLUM PALS | 12 | 2 | 0.167 |
| 8. | Rick Cassidy | PLUM PALS | 11 | 2 | 0.182 |
| 9. | Thomas Threat | TCC/KMB | 14 | 2 | 0.143 |
| 10. | Bobby Woodry | PLUM PALS | 4 | 2 | 0.500 |
| Players | Team | AB | SAC. FLIES | SF/AB | |
| 1. | Emillio DiBiasio | DIVERSIFIED MACHINE | 2 | 1 | 0.500 |
| 2. | Doug Agnew | DIVERSIFIED MACHINE | 2 | 1 | 0.500 |
| 3. | Brian Levon | MISFITS | 11 | 1 | 0.091 |
| 4. | Bill Malovrh | MISFITS | 10 | 1 | 0.100 |
| 5. | Bruce Richert | MISFITS | 10 | 1 | 0.100 |
| 6. | Frank Piazza | MISFITS | 11 | 1 | 0.091 |
| 7. | Mike Tolar | TCC/KMB | 10 | 1 | 0.100 |
| 8. | Greg Trivisono | TCC/KMB | 10 | 1 | 0.100 |
| 9. | Chris Pastiva | PLUM PALS | 12 | 1 | 0.083 |
| 10. | Mike Plum | PLUM PALS | 10 | 1 | 0.100 |
| Players | Team | AB | OBE | OBE/AB | |
| 1. | Joe Fullove | TCC/KMB | 16 | 2 | 0.125 |
| 2. | Brian Kerns | MISFITS | 11 | 1 | 0.091 |
| 3. | Reggie Farmer | TCC/KMB | 14 | 1 | 0.071 |
| 4. | Ed Wilson | DIVERSIFIED MACHINE | 4 | 1 | 0.250 |
| 5. | Ant Morris | TCC/KMB | 14 | 1 | 0.071 |
| 6. | Mike Tolar | TCC/KMB | 10 | 1 | 0.100 |
| 7. | Chris Pastiva | PLUM PALS | 12 | 1 | 0.083 |
| 8. | Mike Plum | PLUM PALS | 10 | 1 | 0.100 |
| 9. | Rick Zatta | PLUM PALS | 13 | 1 | 0.077 |
| 10. | Dan Gallagher | KOK SENIOR SOFTBALL | 4 | 1 | 0.250 |
|
Player: Joe Bachic Team: PLUM PALS |

| Categories | Statistics | |
| 1. | Games Played | 2 |
| 2. | At Bats | 7 |
| 3. | Hits | 7 |
| 4. | Runs Scored | 6 |
| 5. | Runs Batted In | 14 |
| 6. | Singles | 2 |
| 7. | Doubles | 1 |
| 8. | Triples | 0 |
| 9. | Home Runs | 4 |
| 10. | Walks | 0 |
| 11. | Sacrifice Flies | 0 |
| 12. | On Base by Error | 0 |
| 13. | On Base Percentage | 1.000 |
| 14. | Offensive Potency Ratio | 2.857 |
| 15. | Slugging Percentage | 2.857 |
| 16. | Batting Average | 1.000 |
THIS WEEK'S PLAYER OF THE WEEK NUMBER IS 515 . SEE WHO QUALIFIED FOR THIS WEEK'S POWER PLAYERS!